


Design Student Census
AIGA Data Visualization
Spring 2020
Beginning in 2017, the American Institute of Graphic Arts has collected census data on working designers. The AIGA Design Census provides important insights to the design industry and the people who make it up. However, data is only collected on current working professionals. What about the design students, who are the future of the design industry? There is much valuable information that can be obtained from design students. Who are the design students of today? Where do they stand on the topics of design education, career prospects, and where the industry is headed?
Informed by the AIGA Design Census of 2019 and using the data as a starting point, we shift our attention from current professionals to those who will be shaping the industry’s future. To accomplish this, we provided the participants with a flexible response format in the form of a responsive workbook to collect data. Using this data from the workbook, we decided the final composition will depend on their collective choices. We then analyzed the data and visualized the responses through an interactive webpage.

Responsive Workbook
There are three sections to the workbook each with different types of questions.
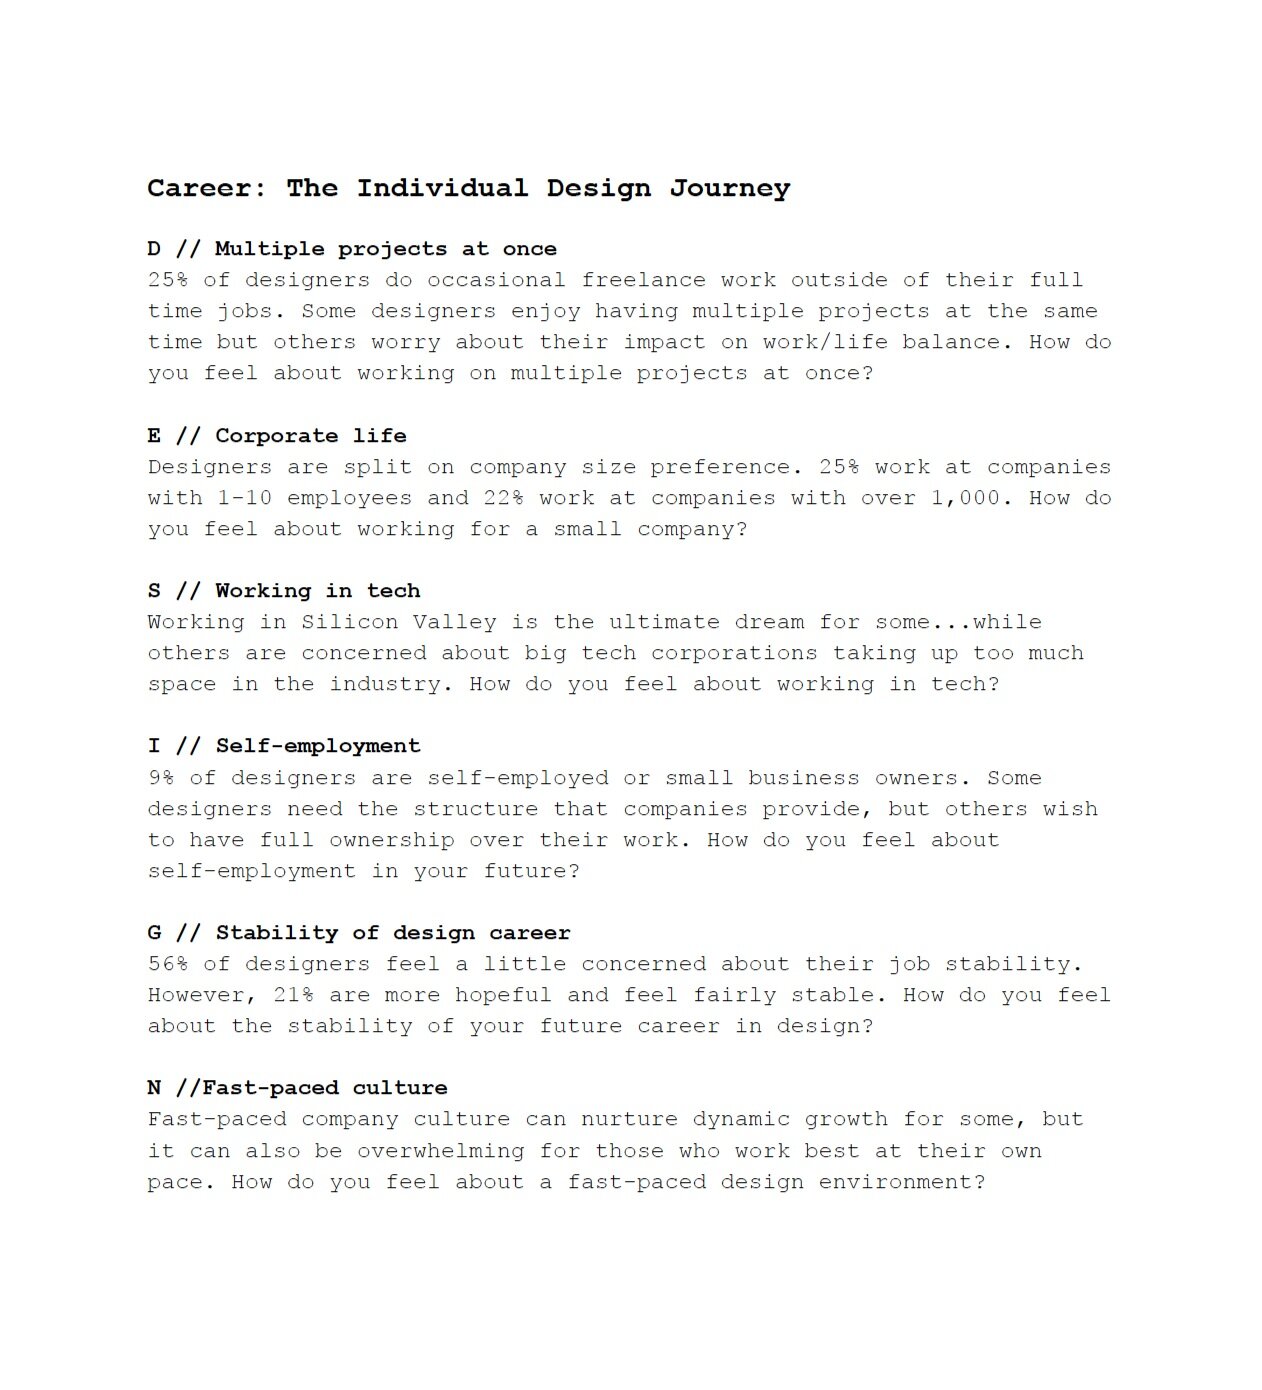
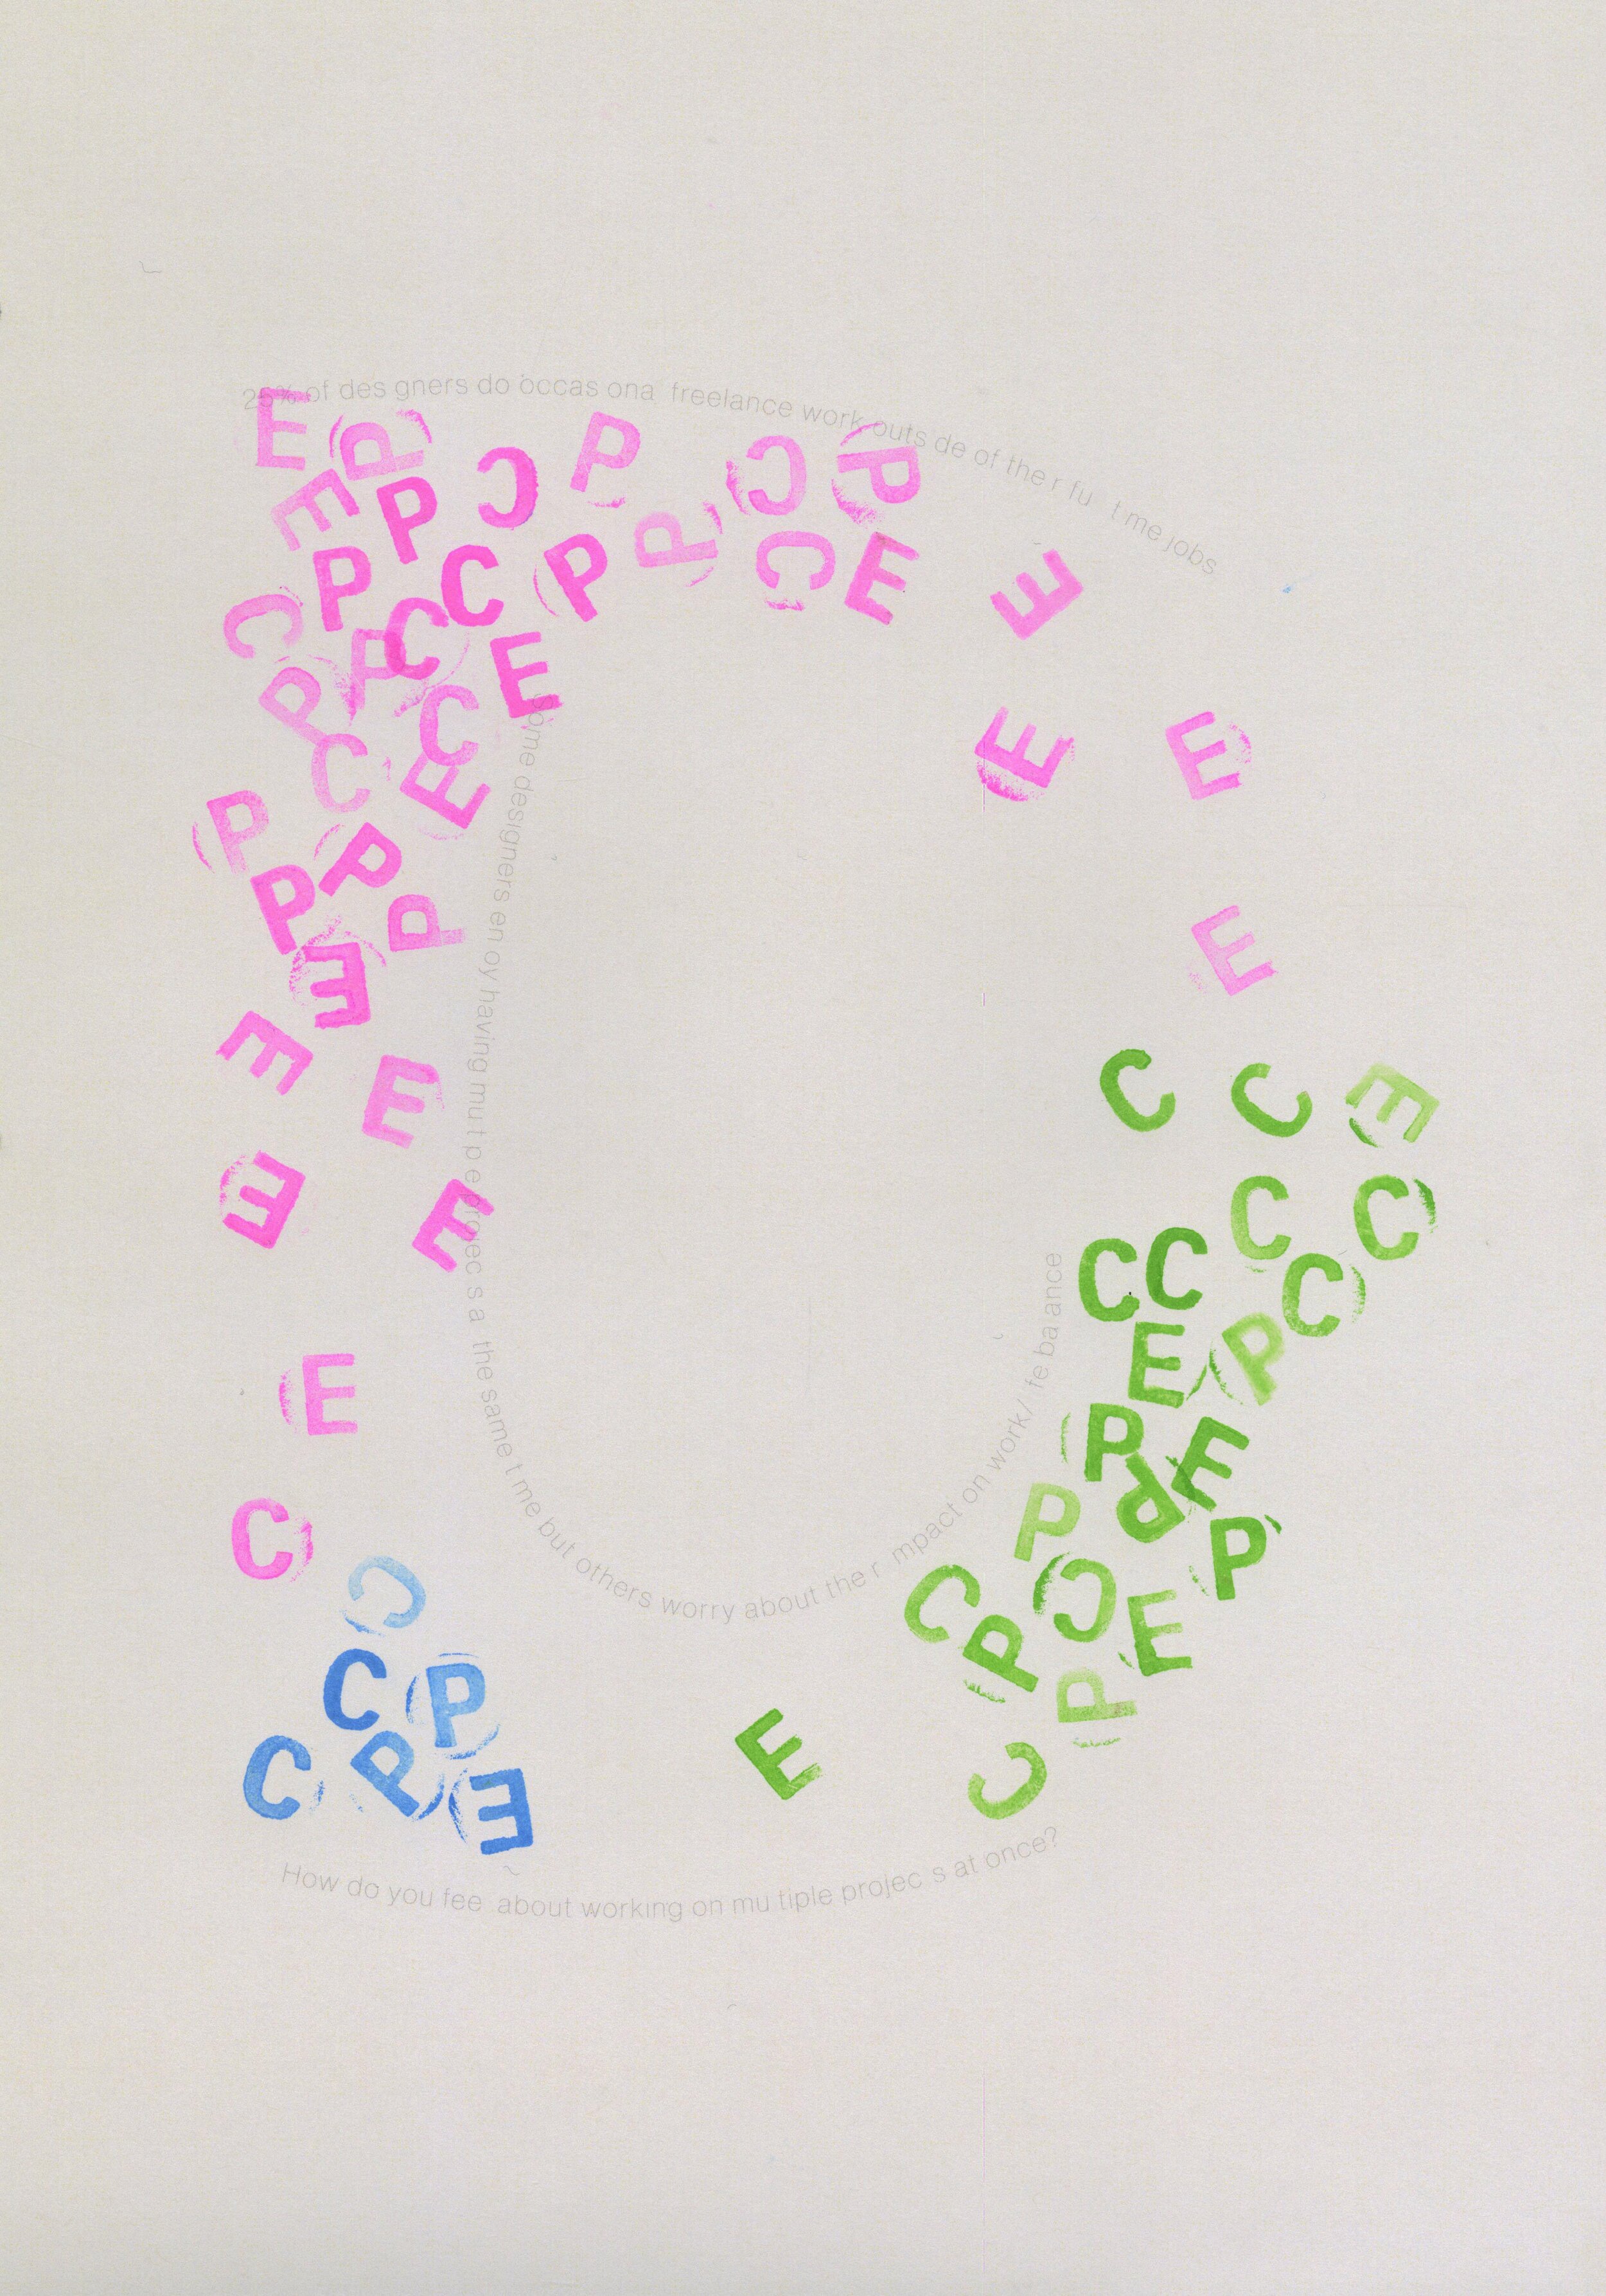
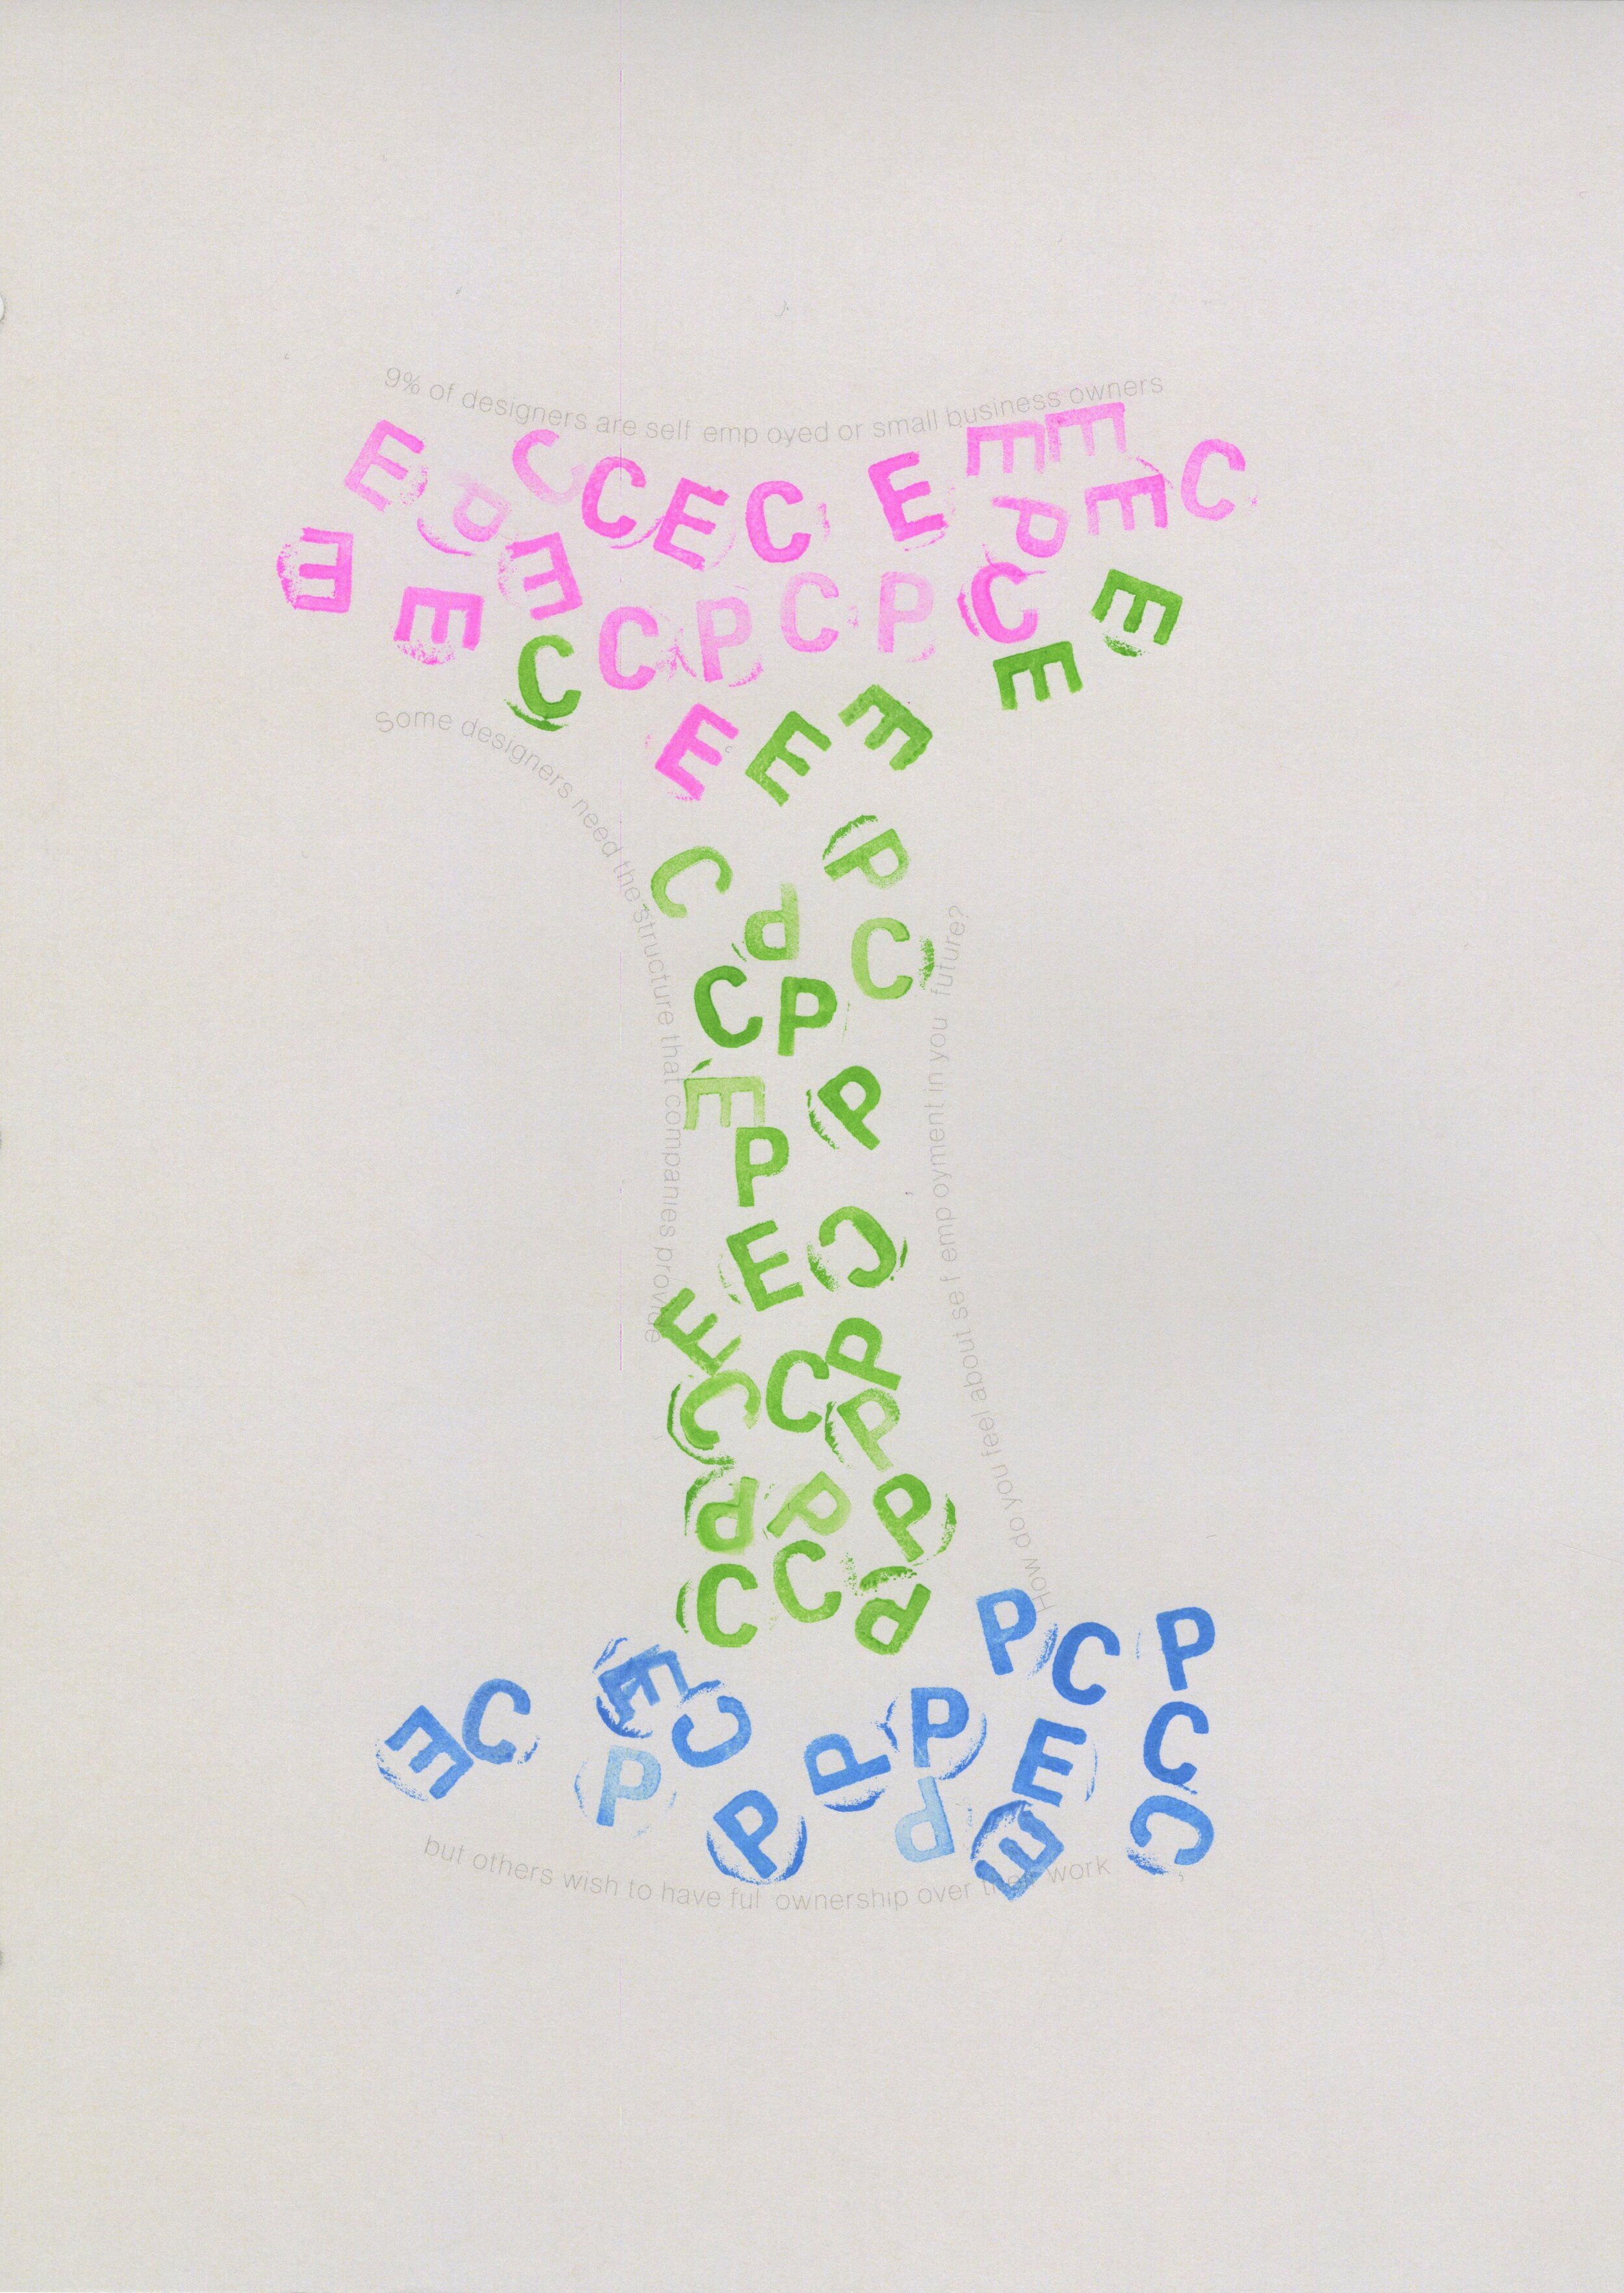
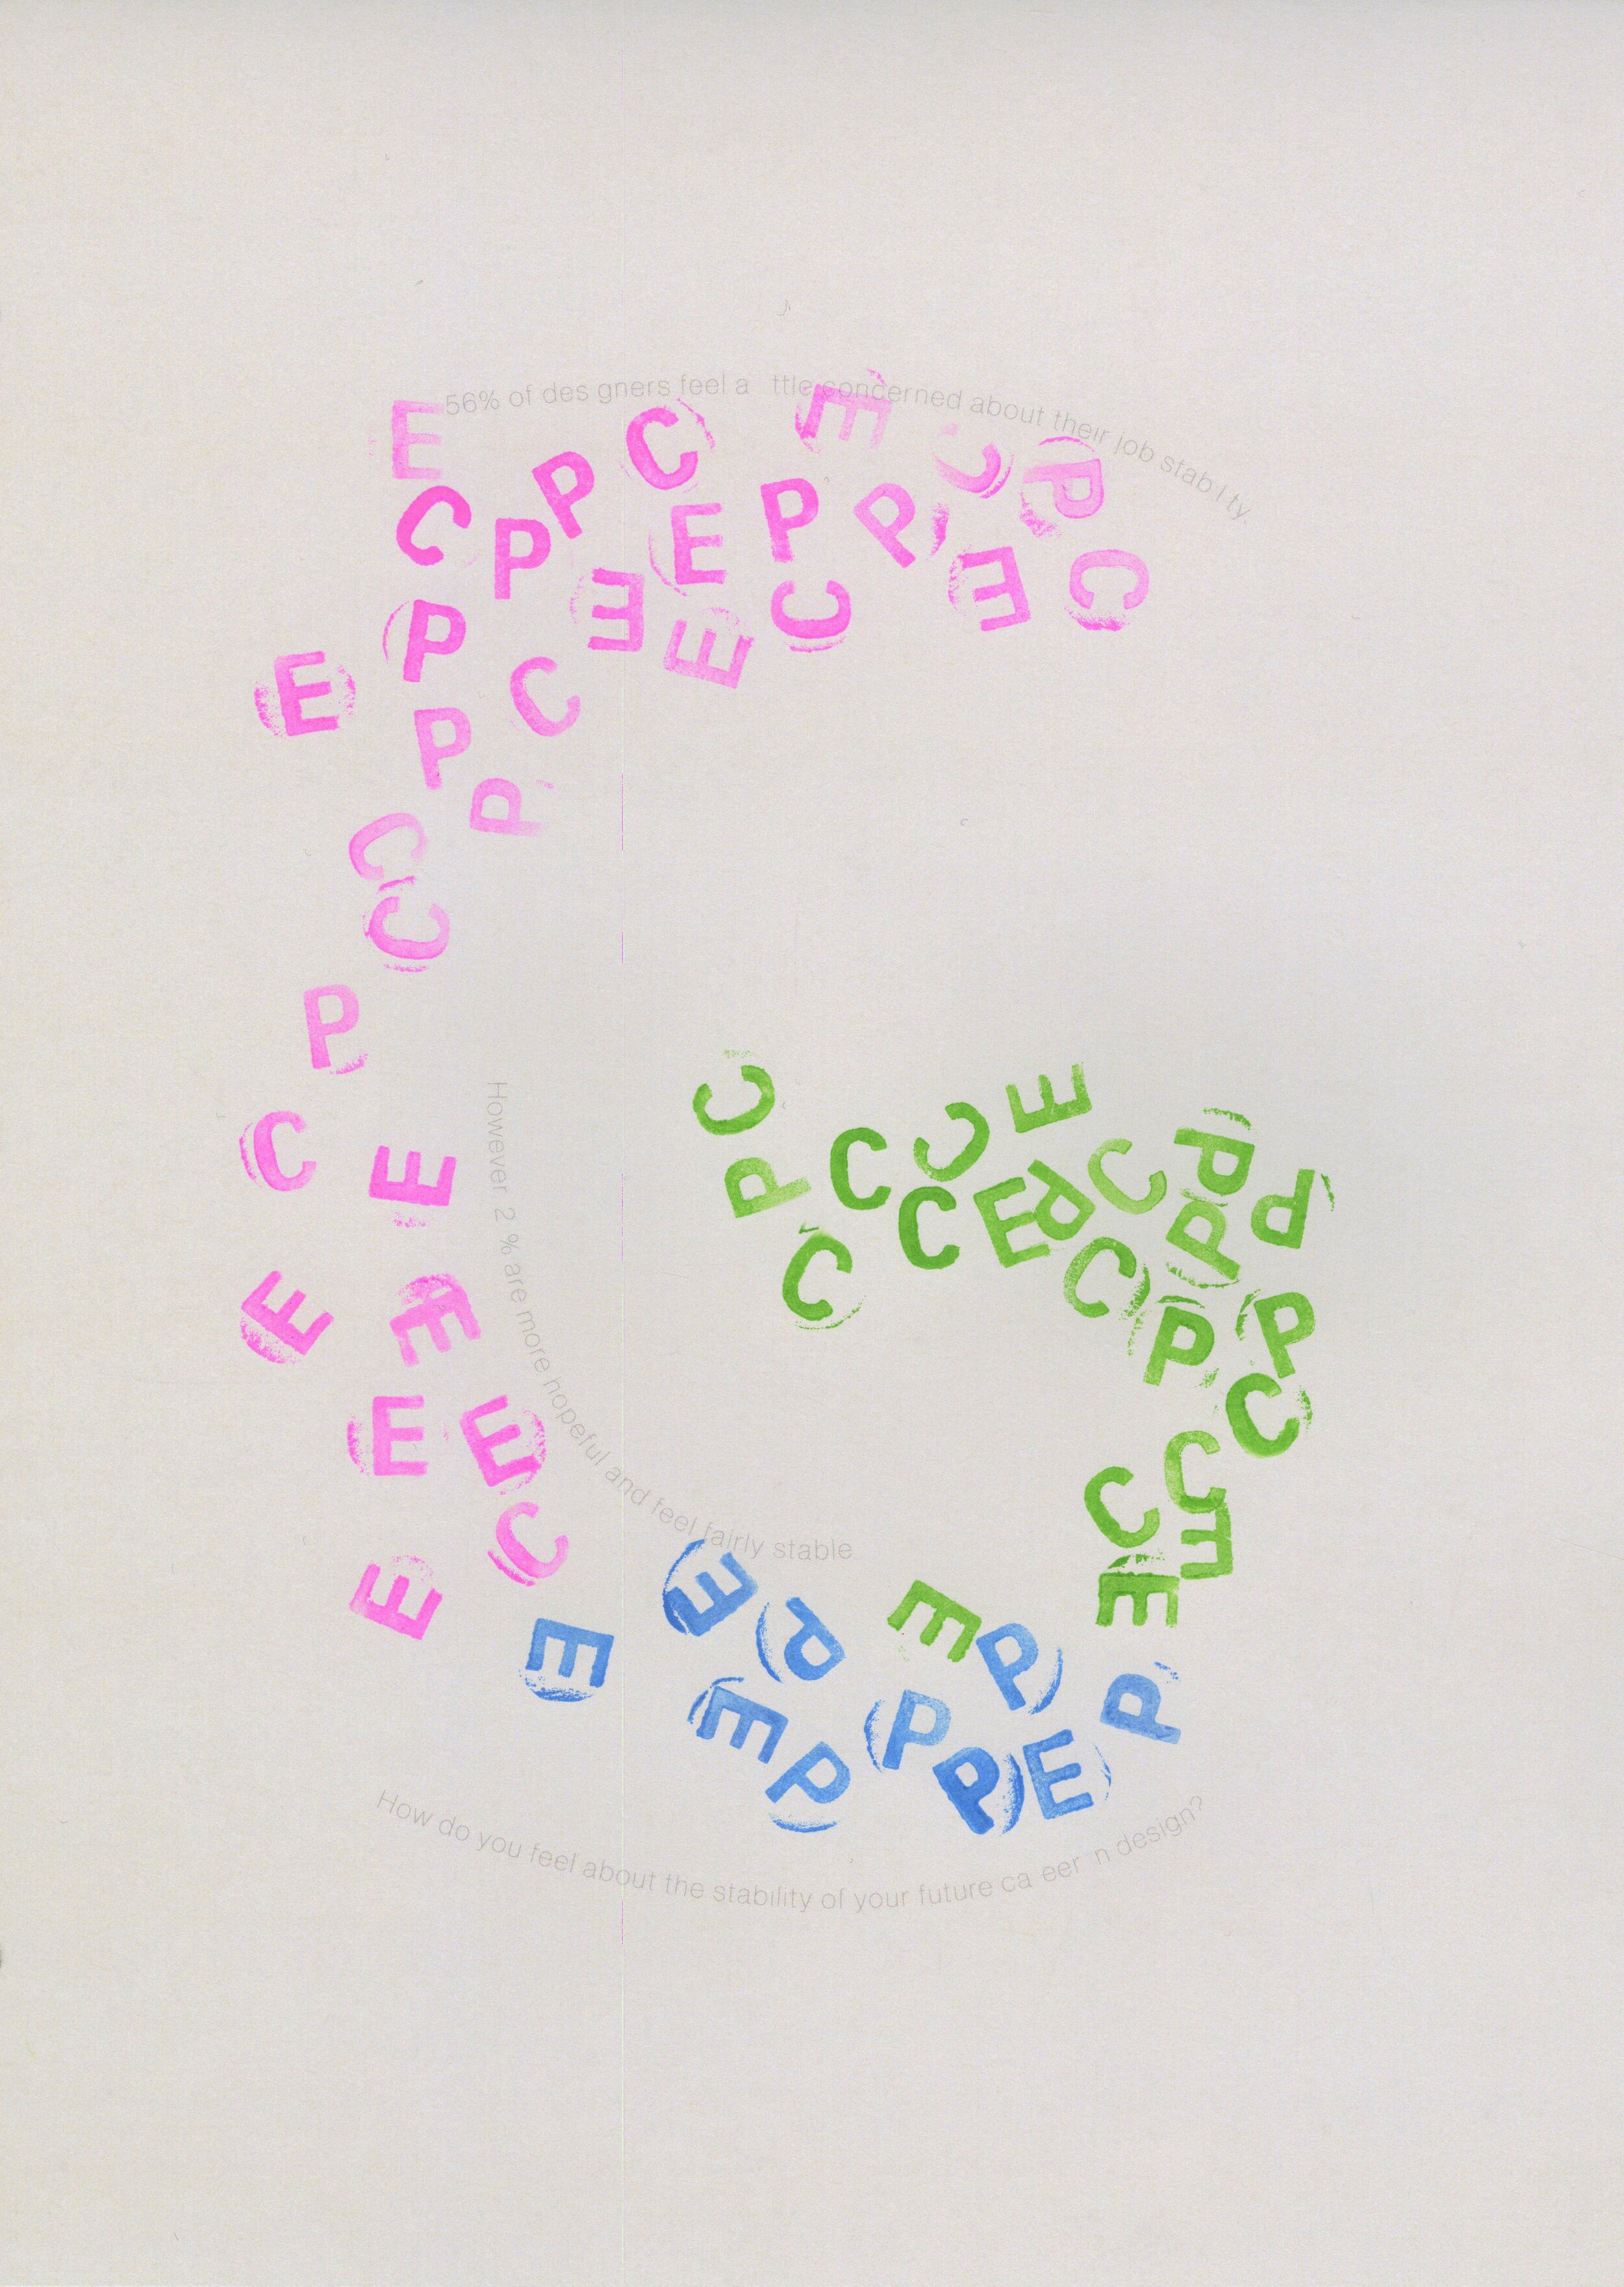
Career: The Individual Design Journey
Education: The State of Design Learning
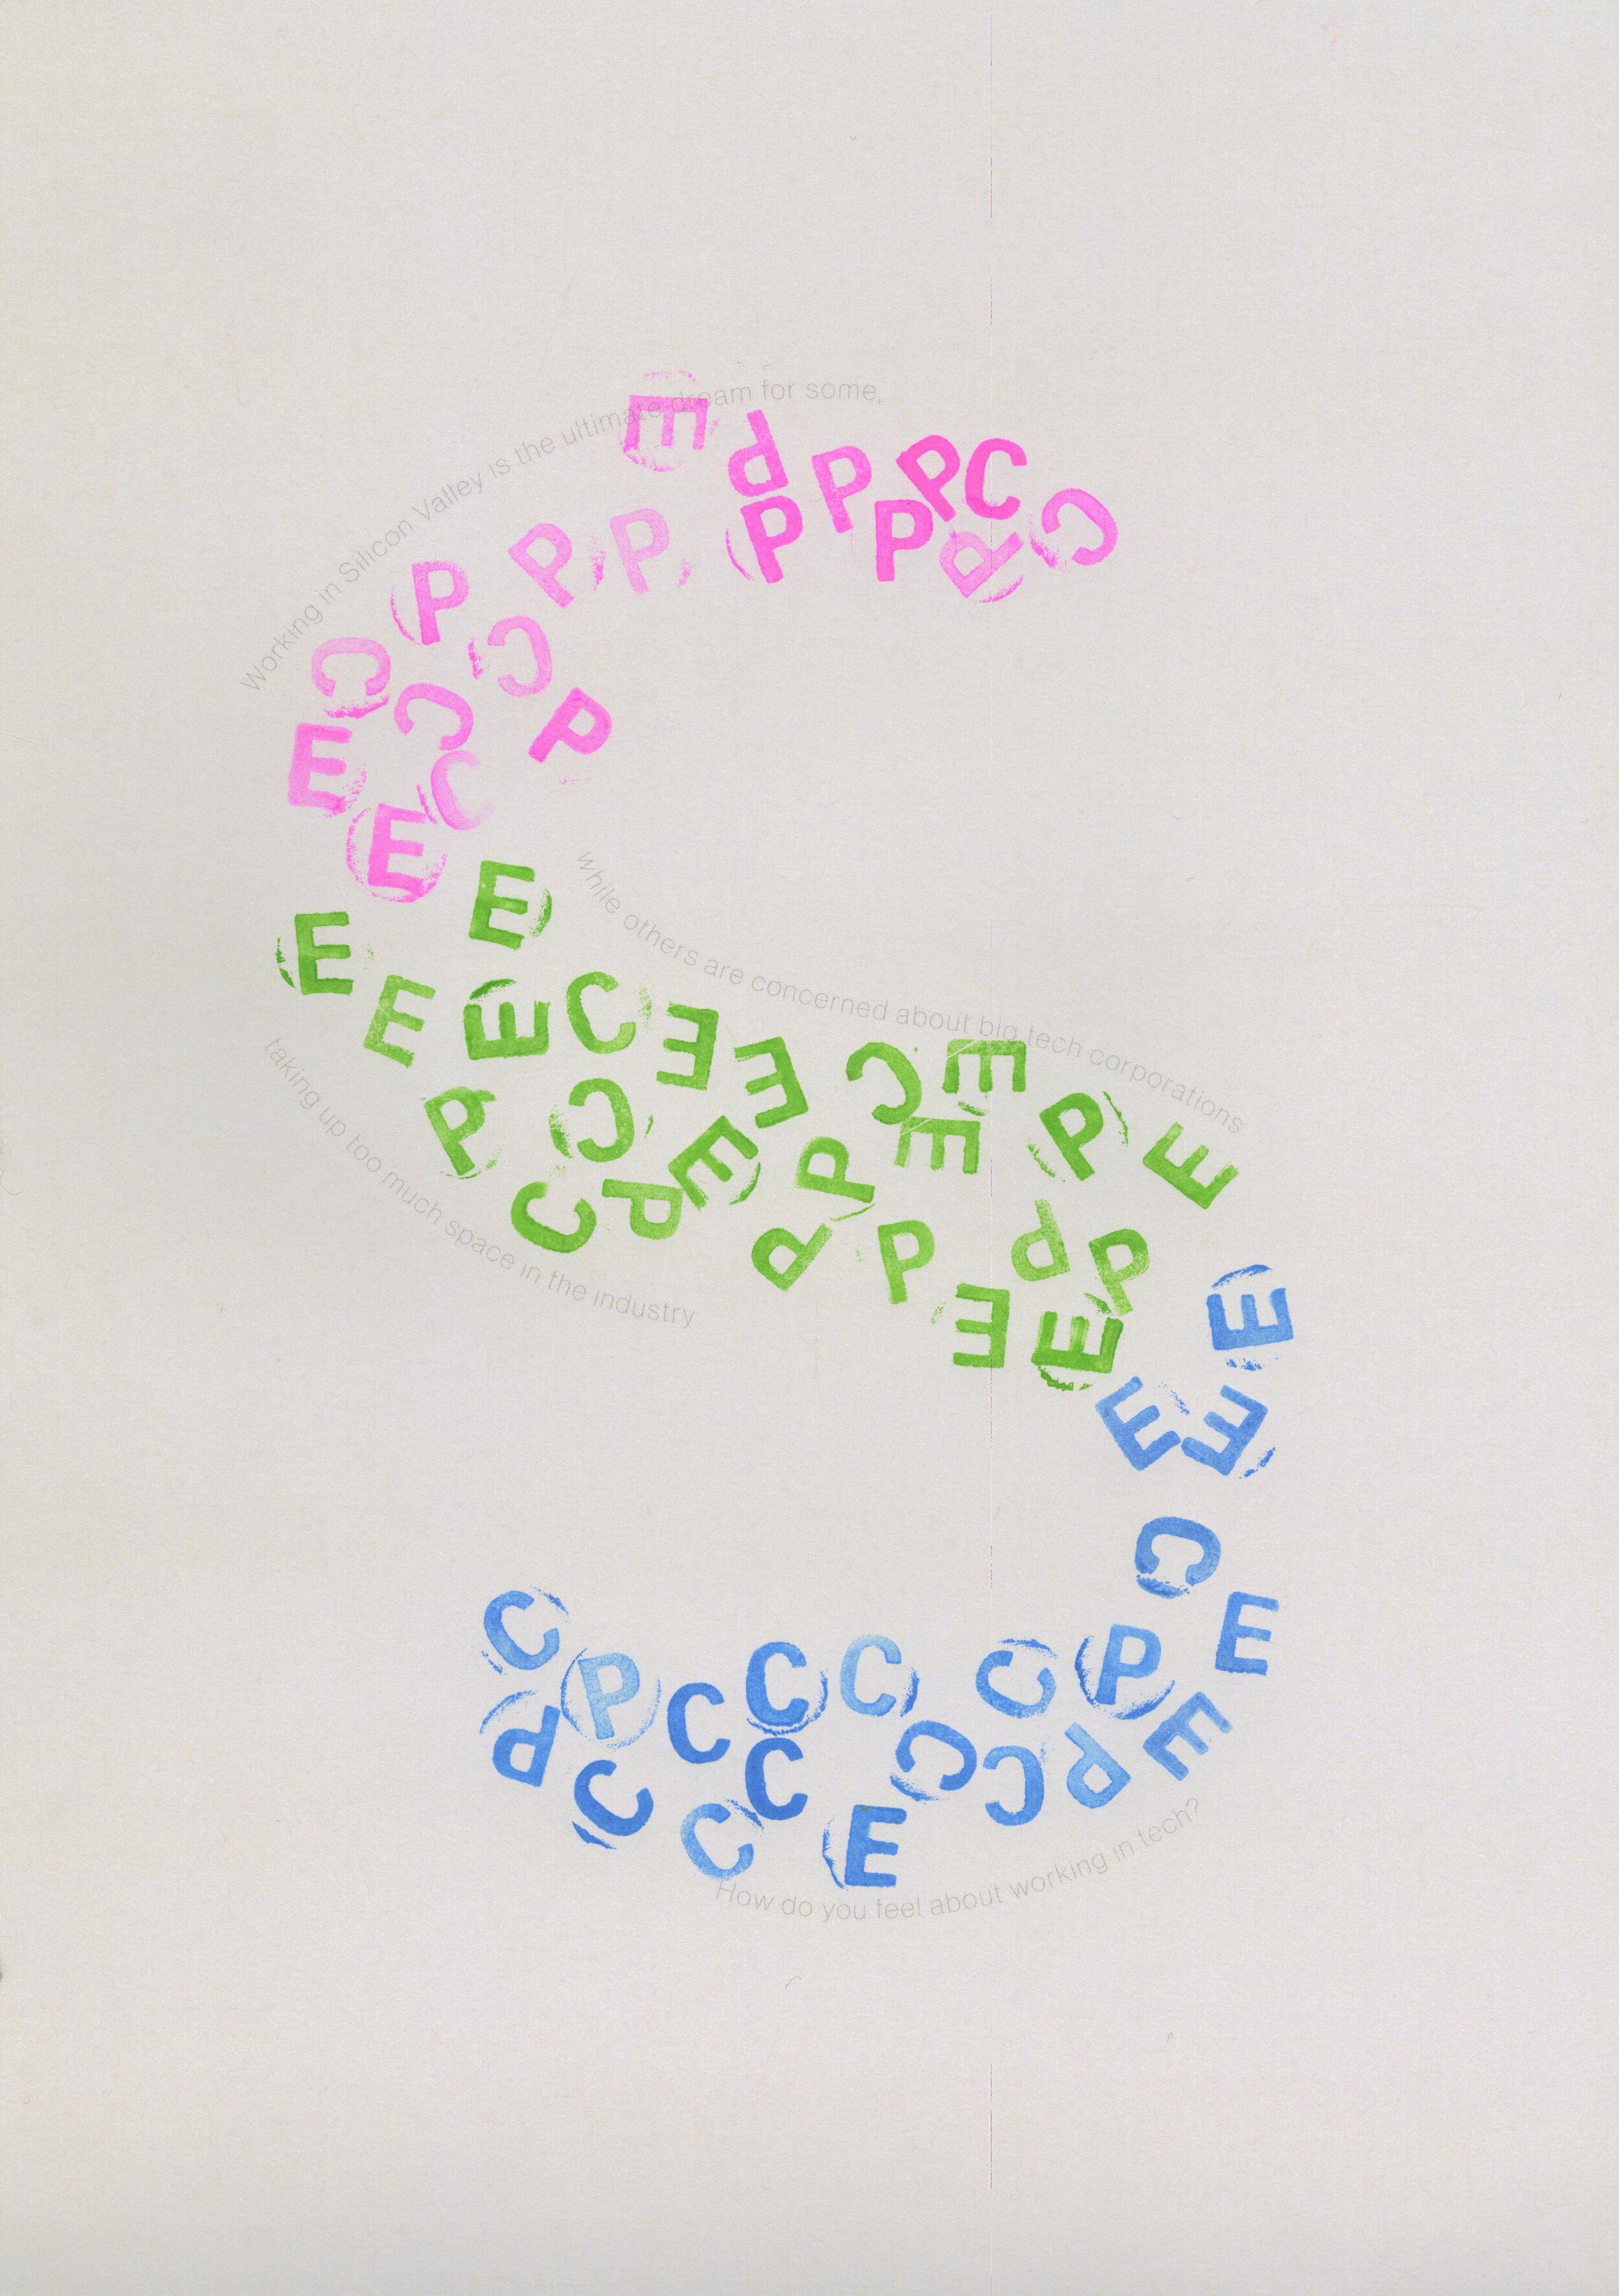
Industry: The Collective Design Journey
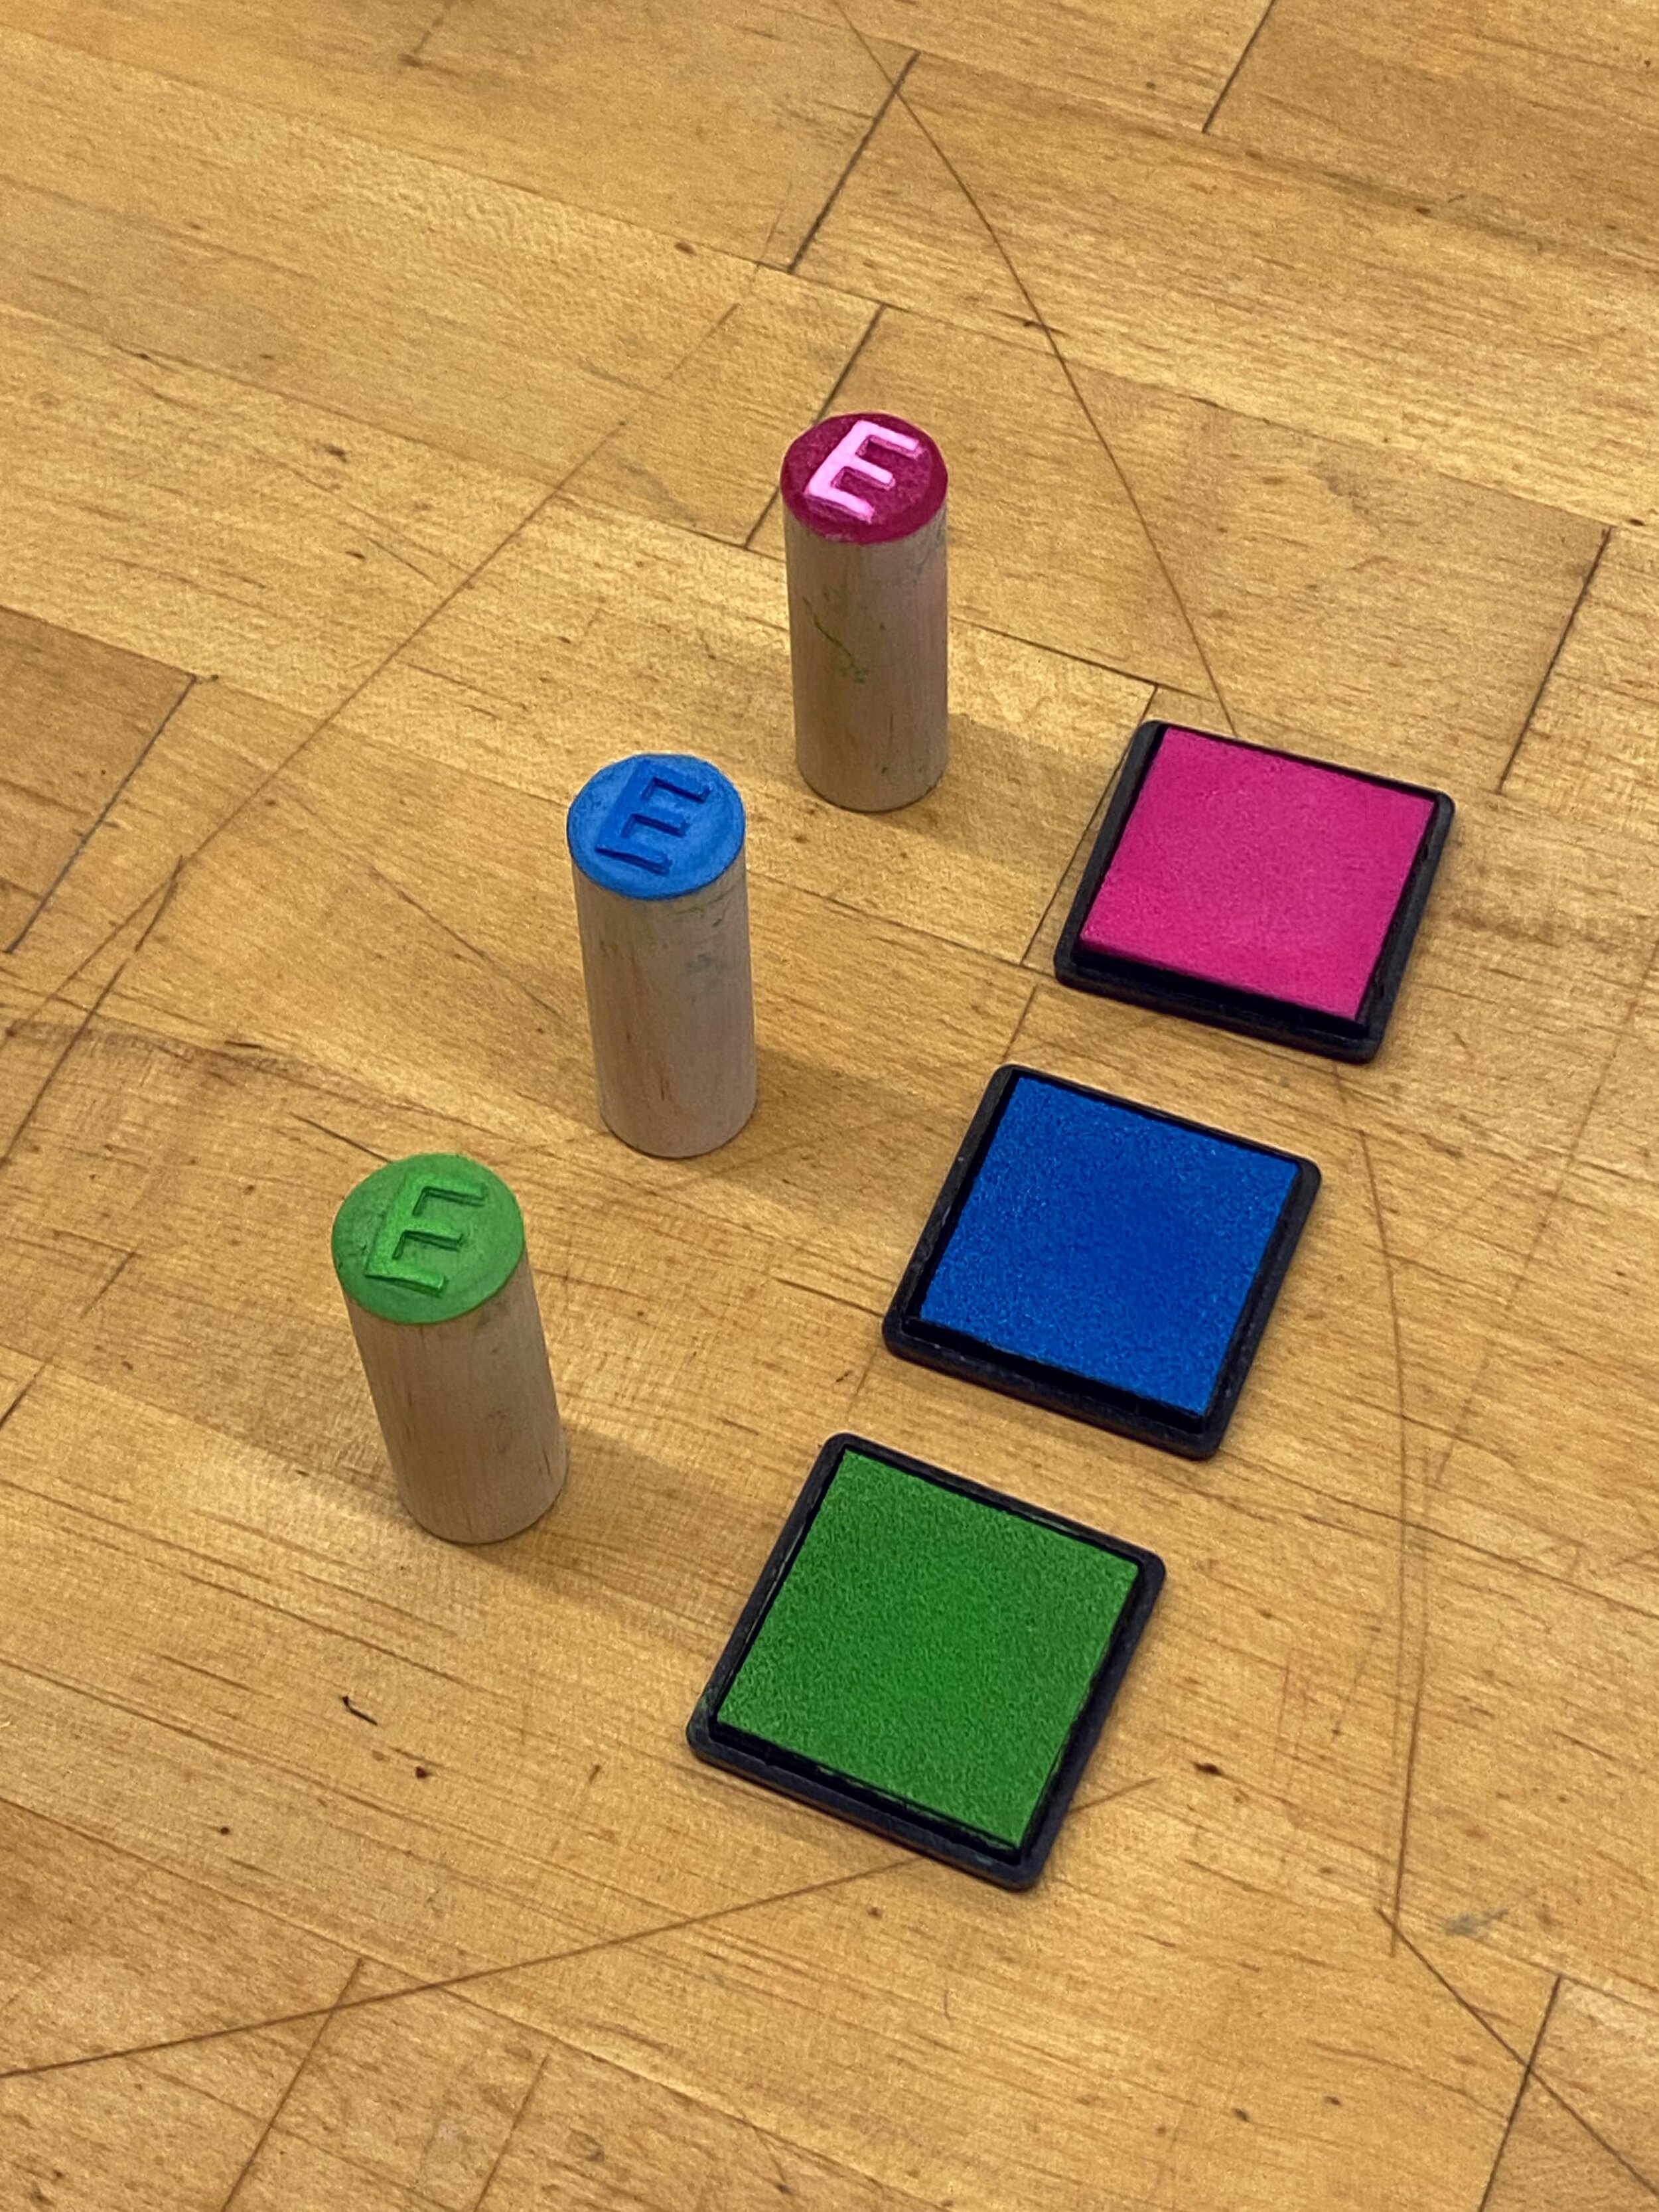
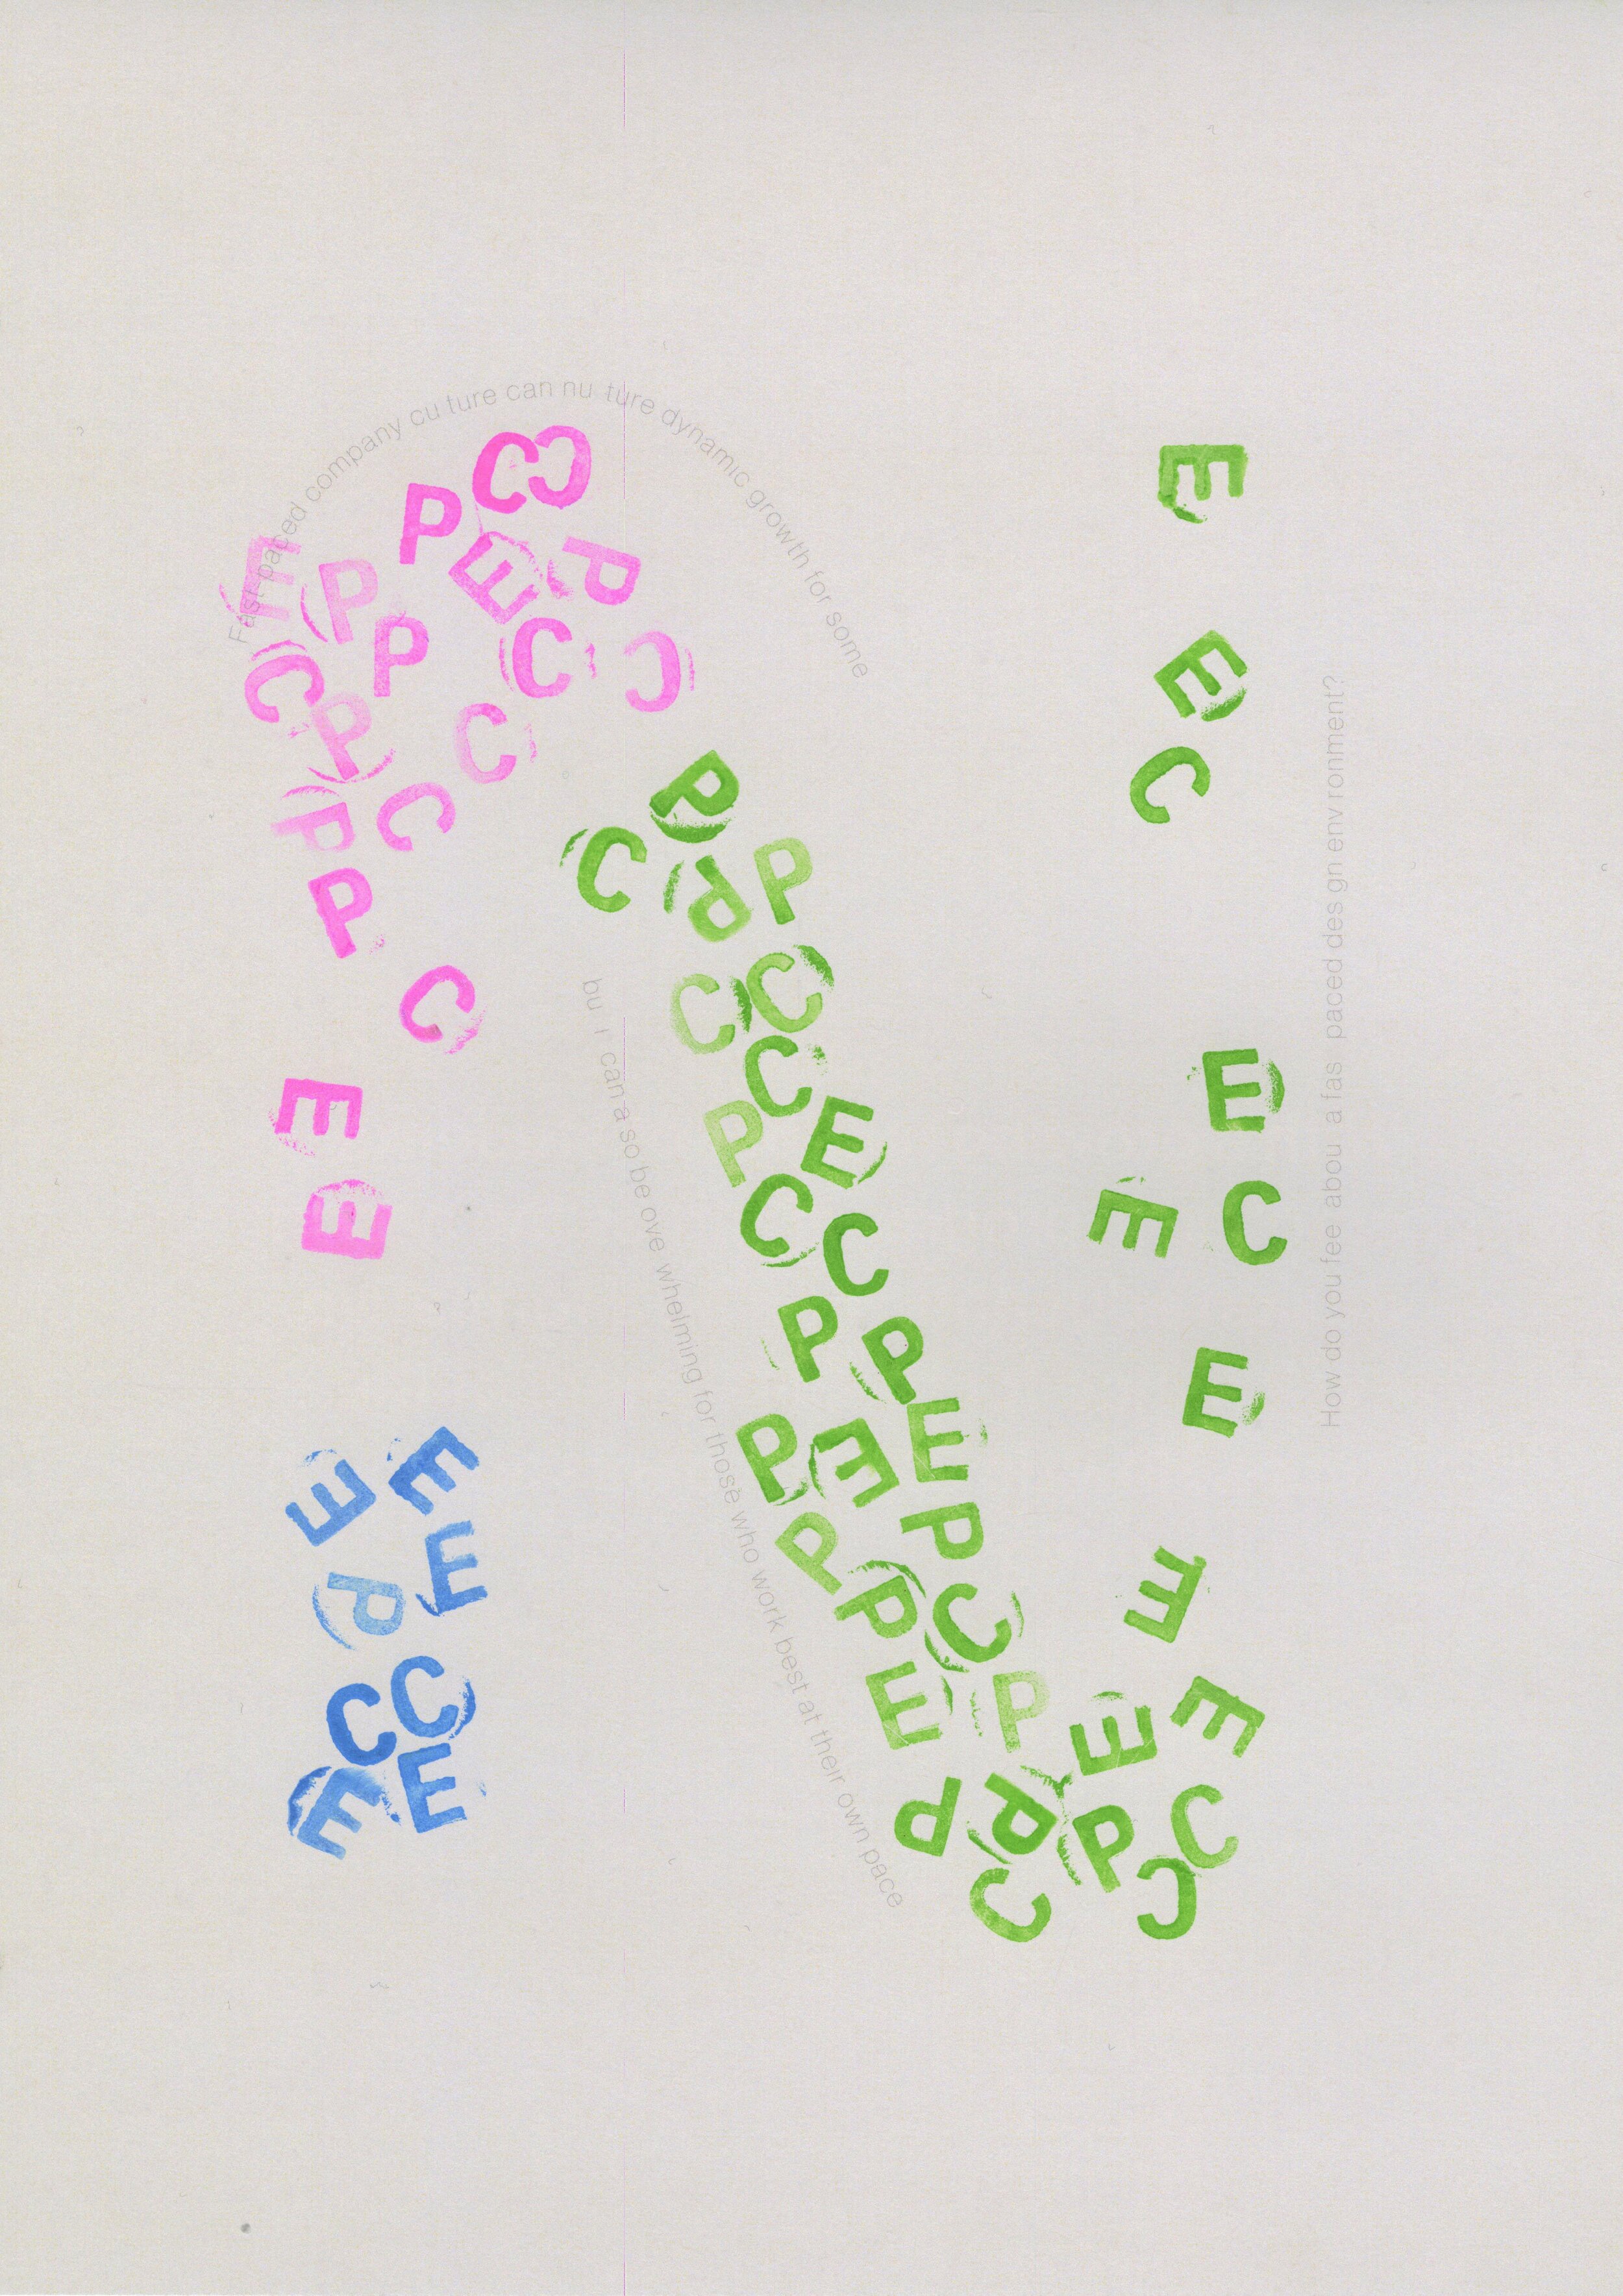
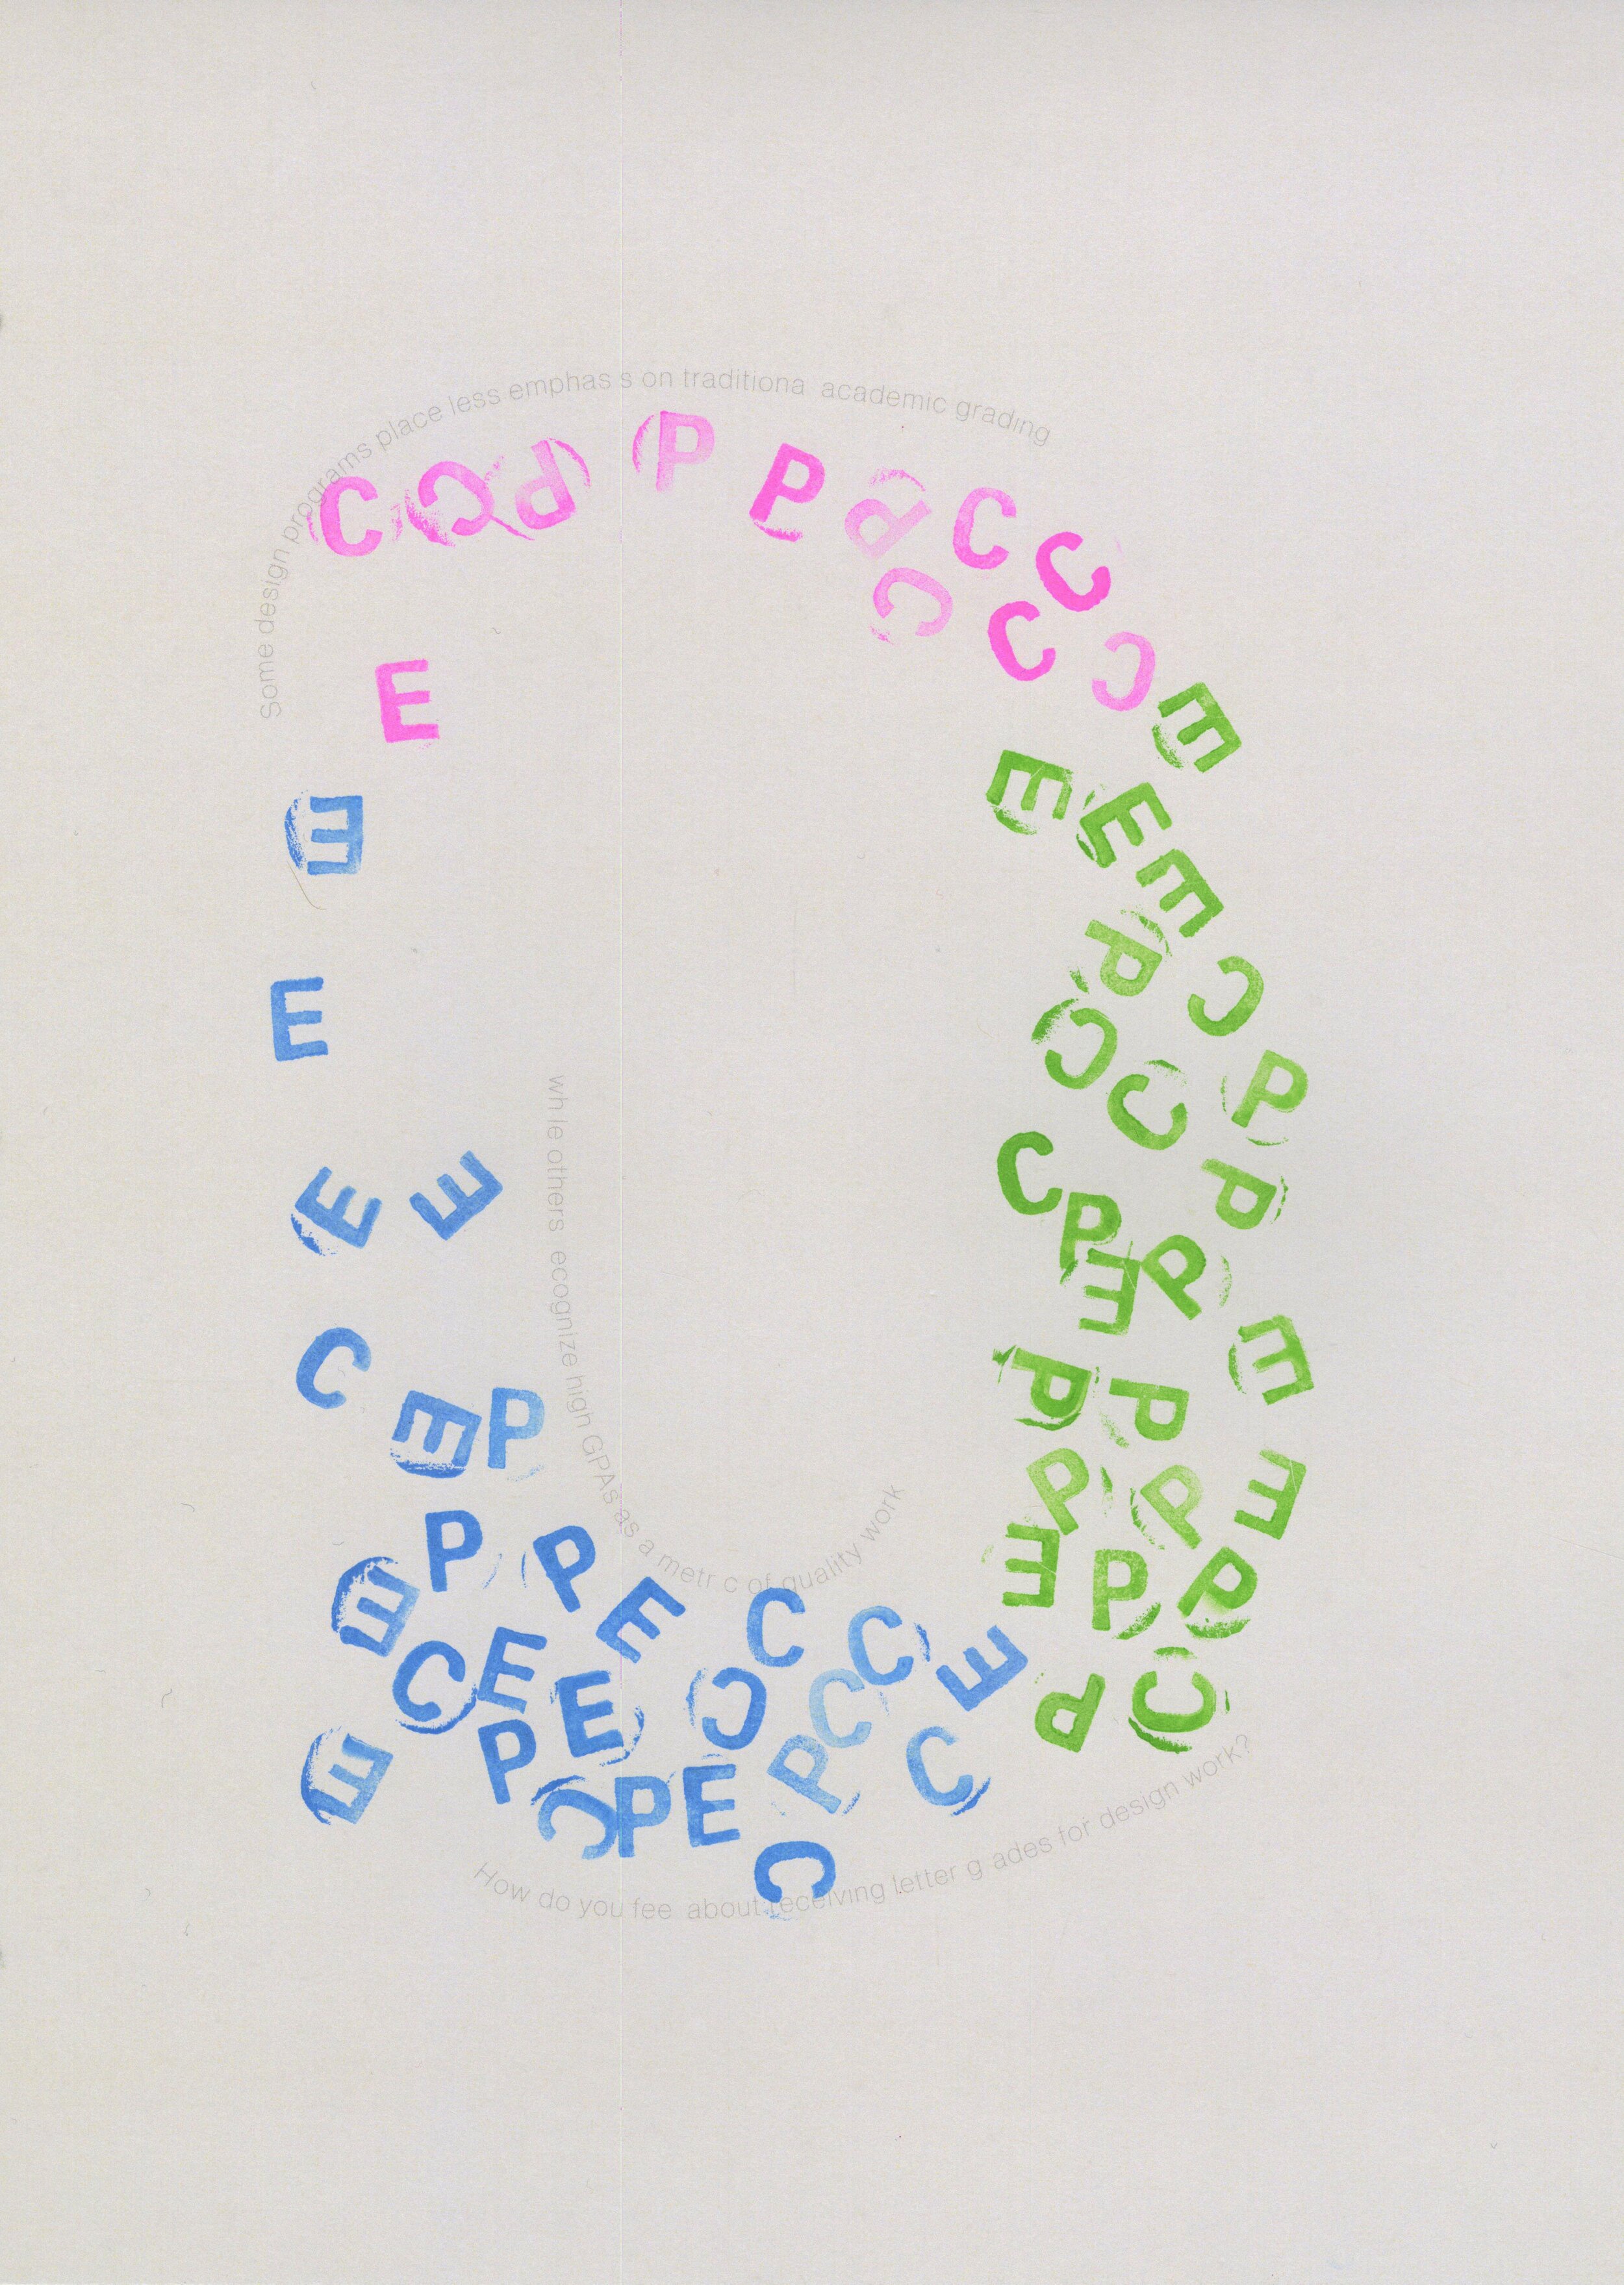
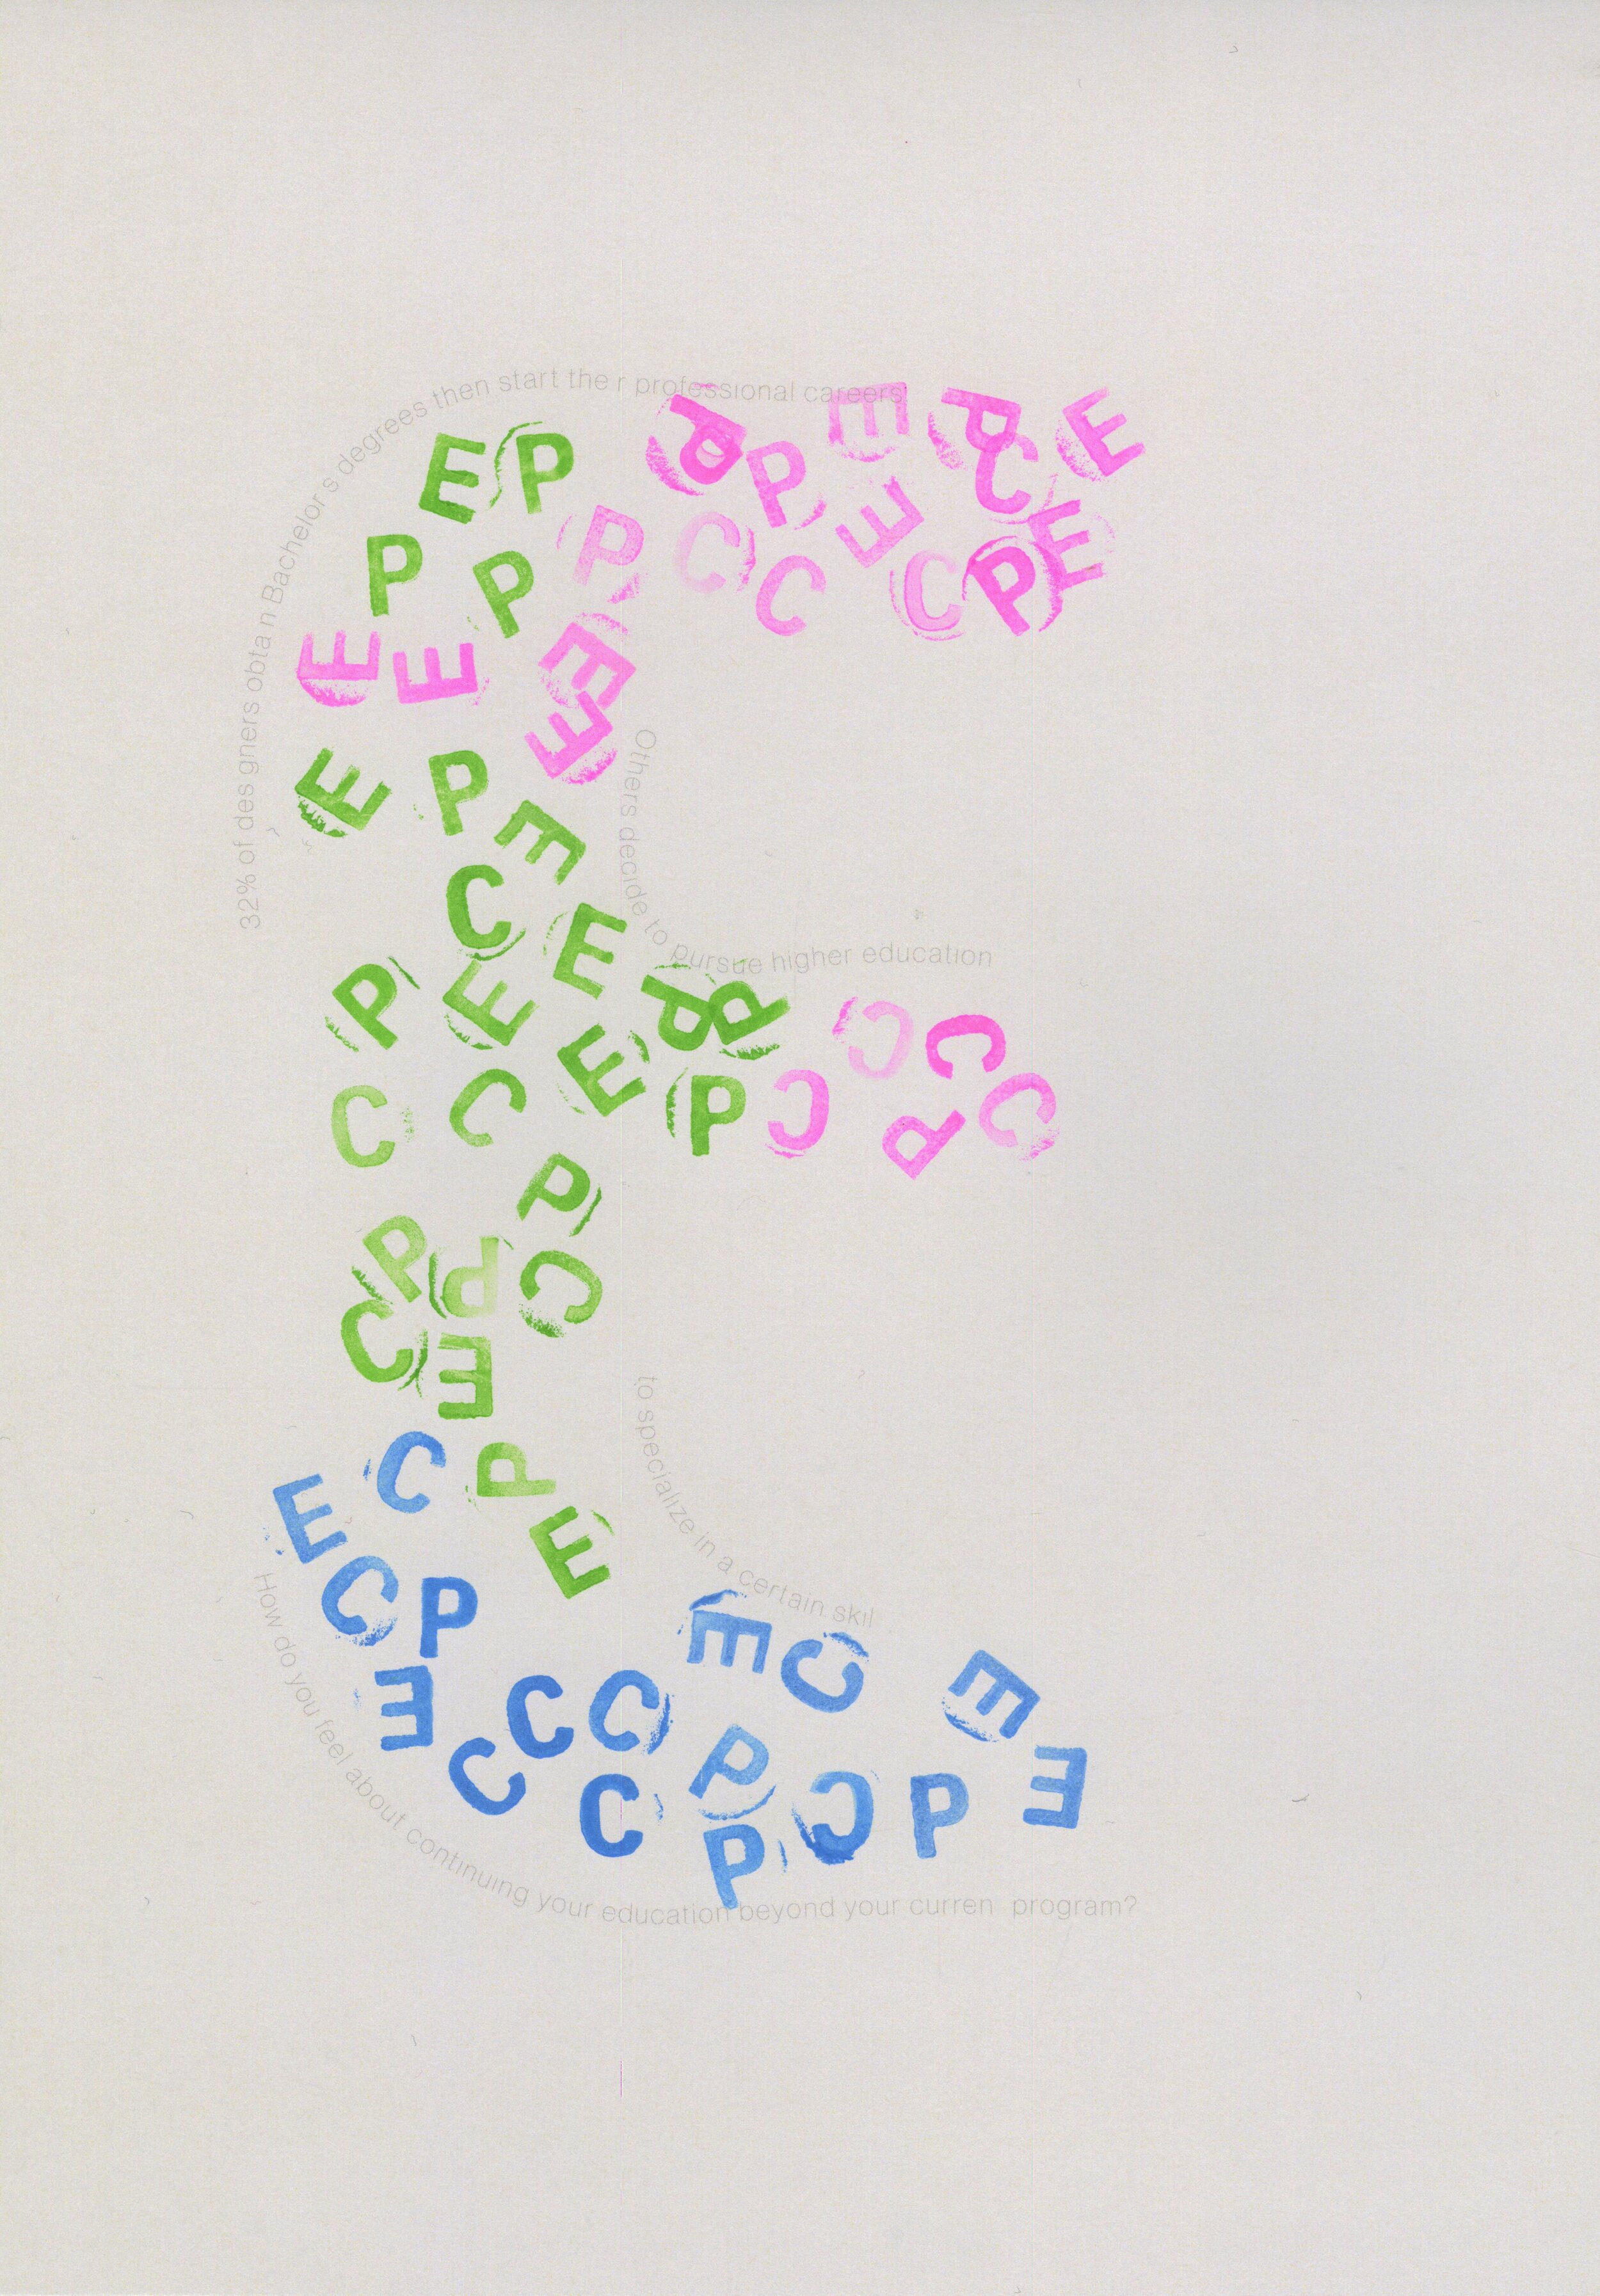
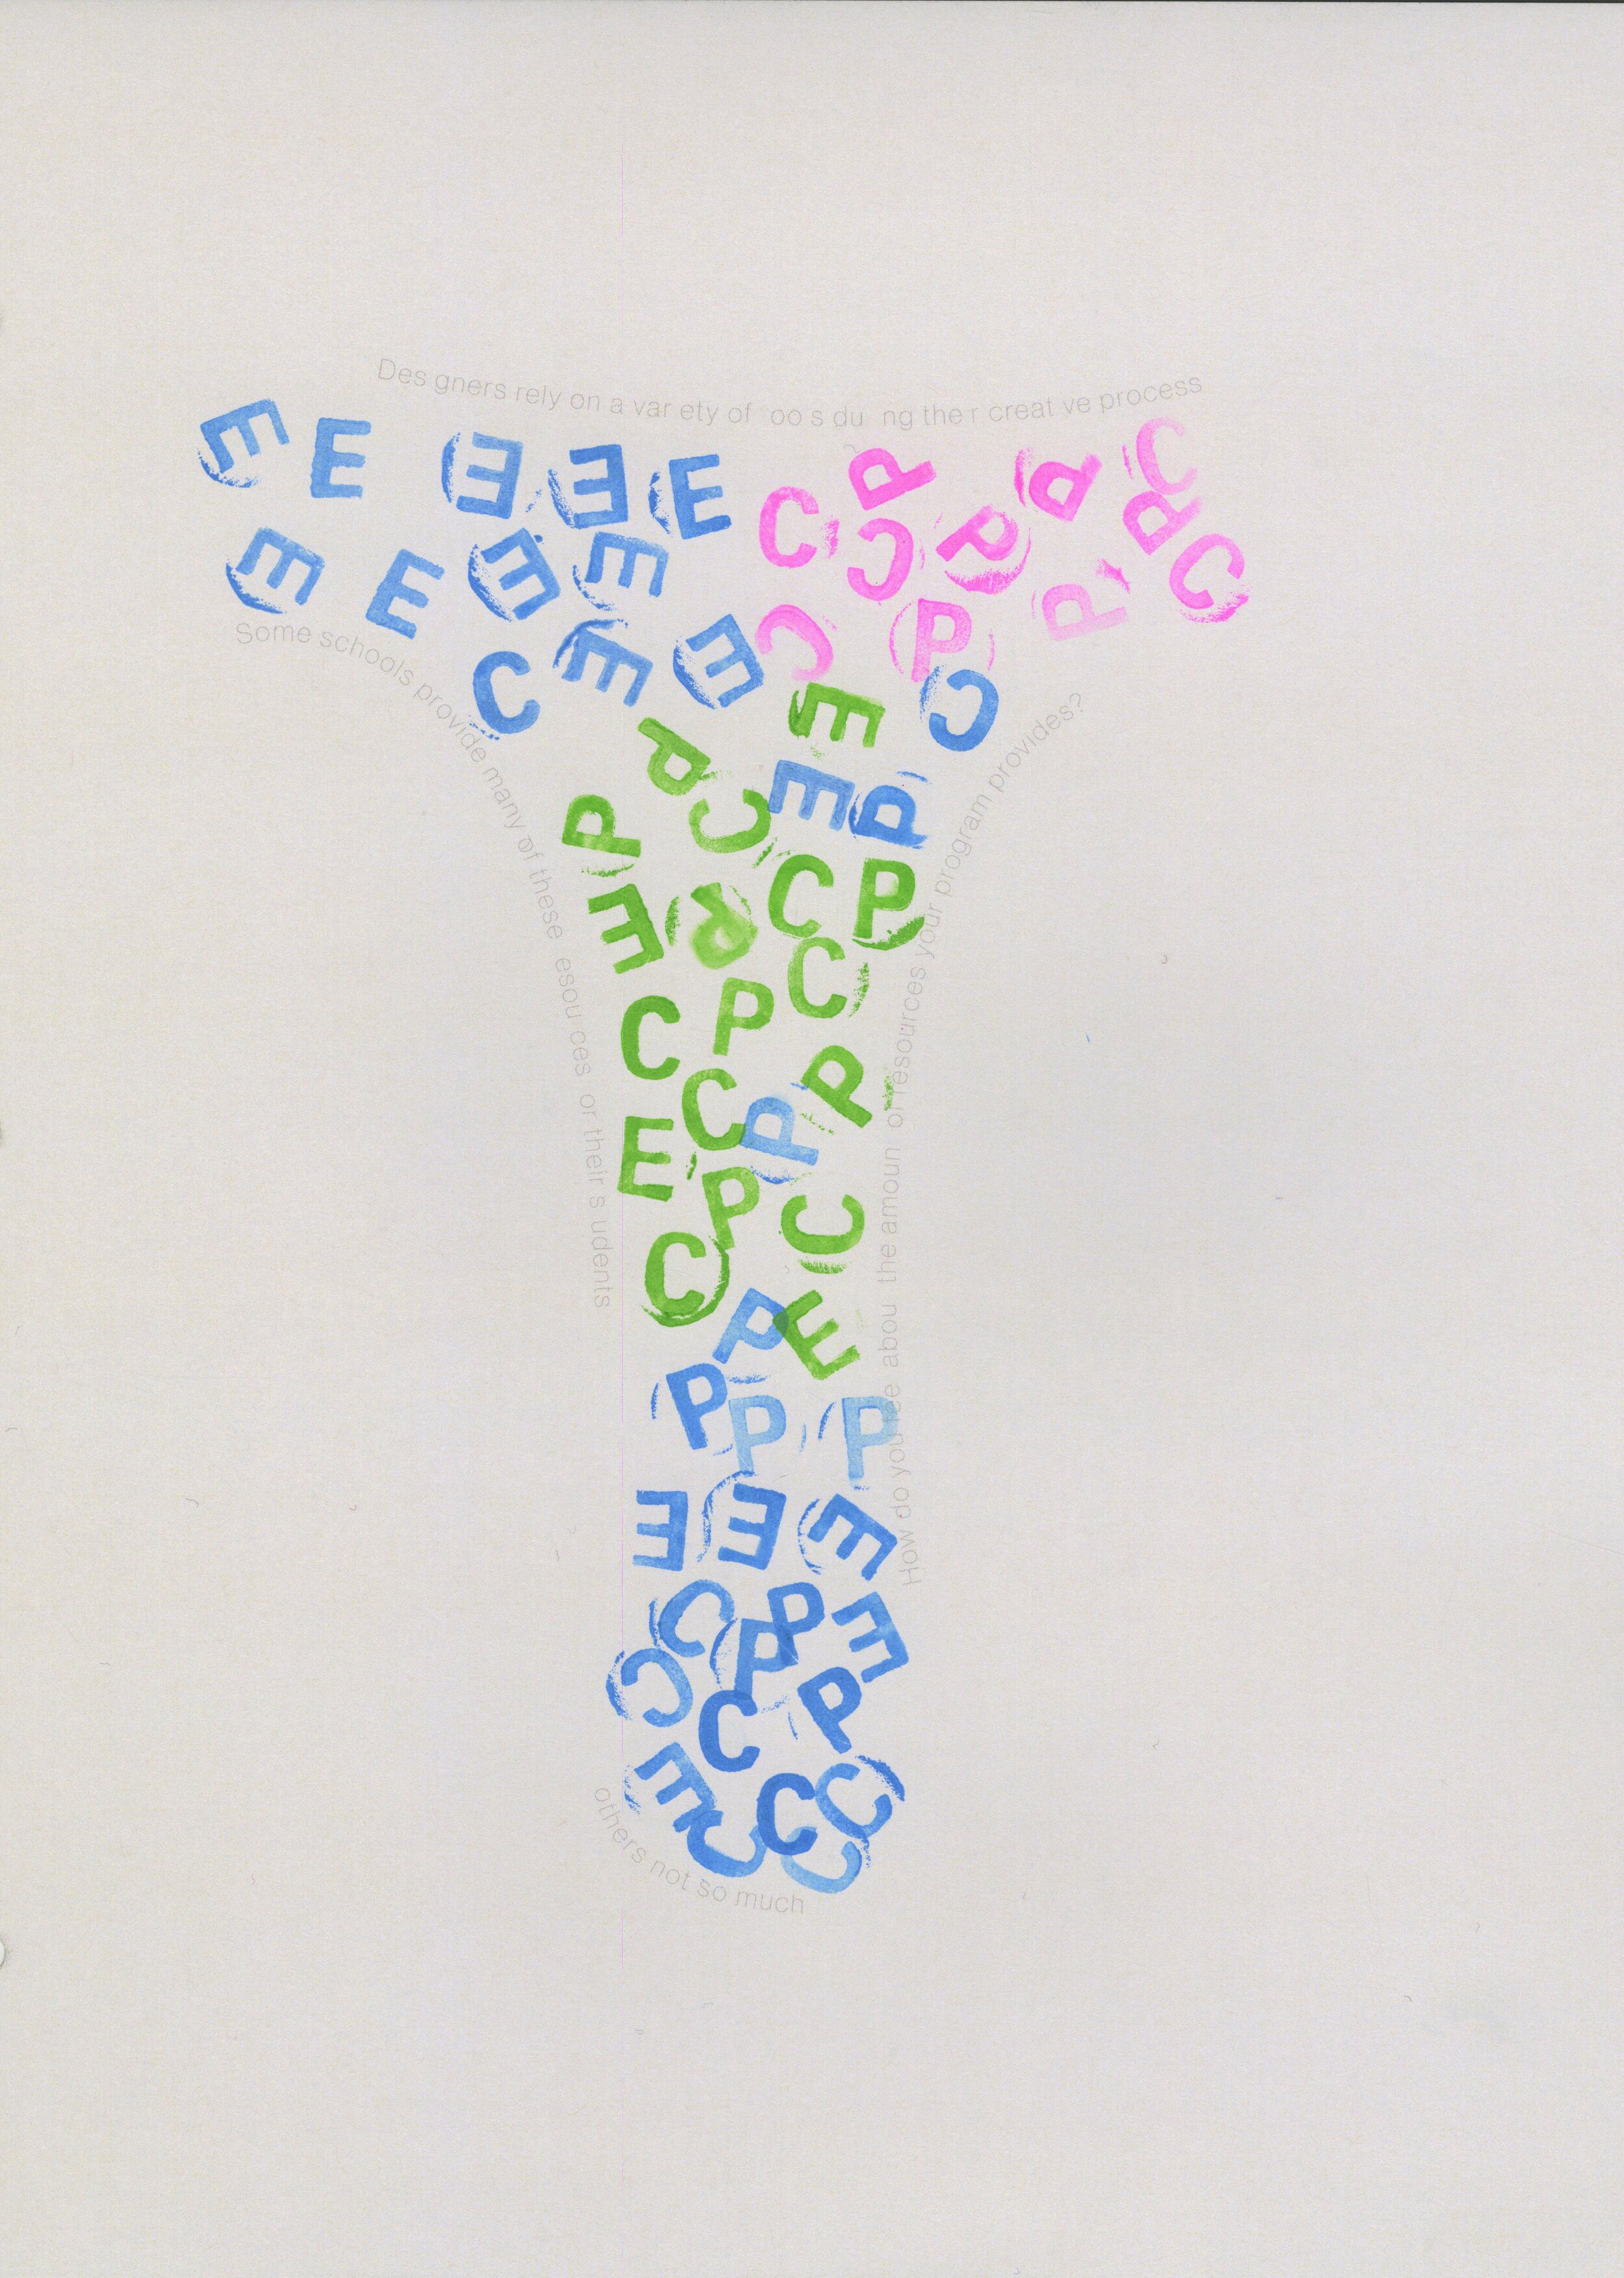
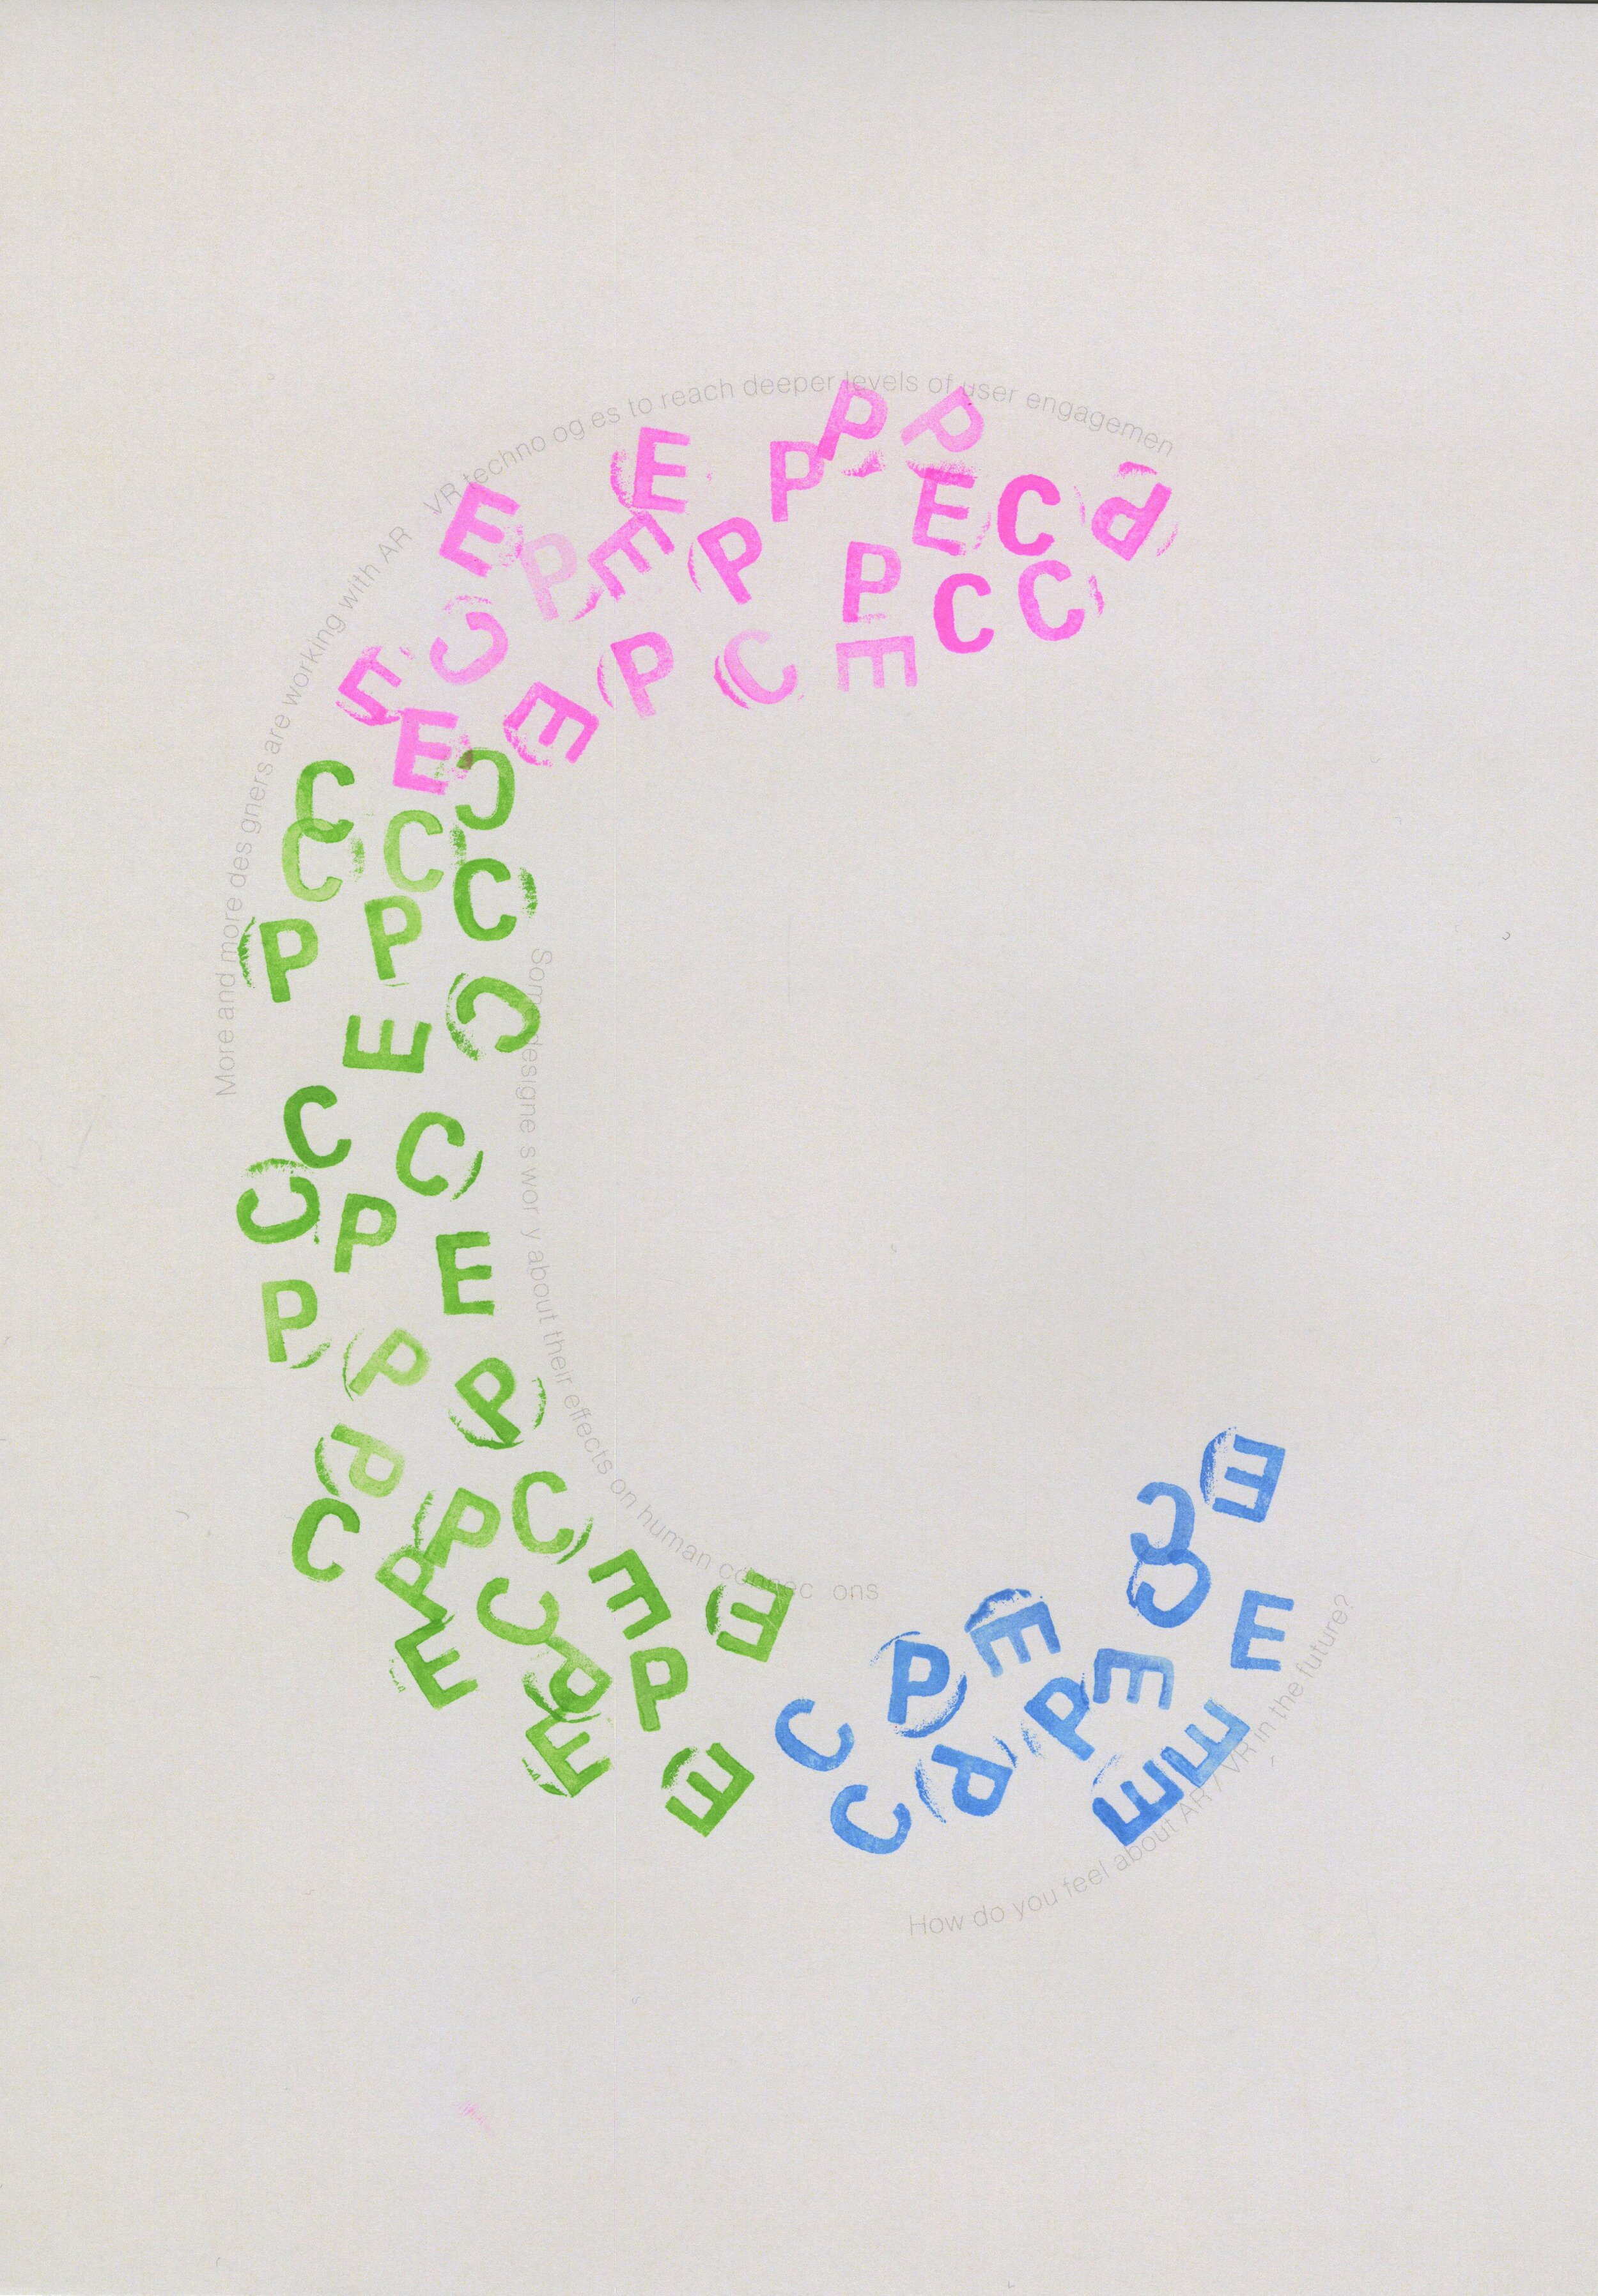
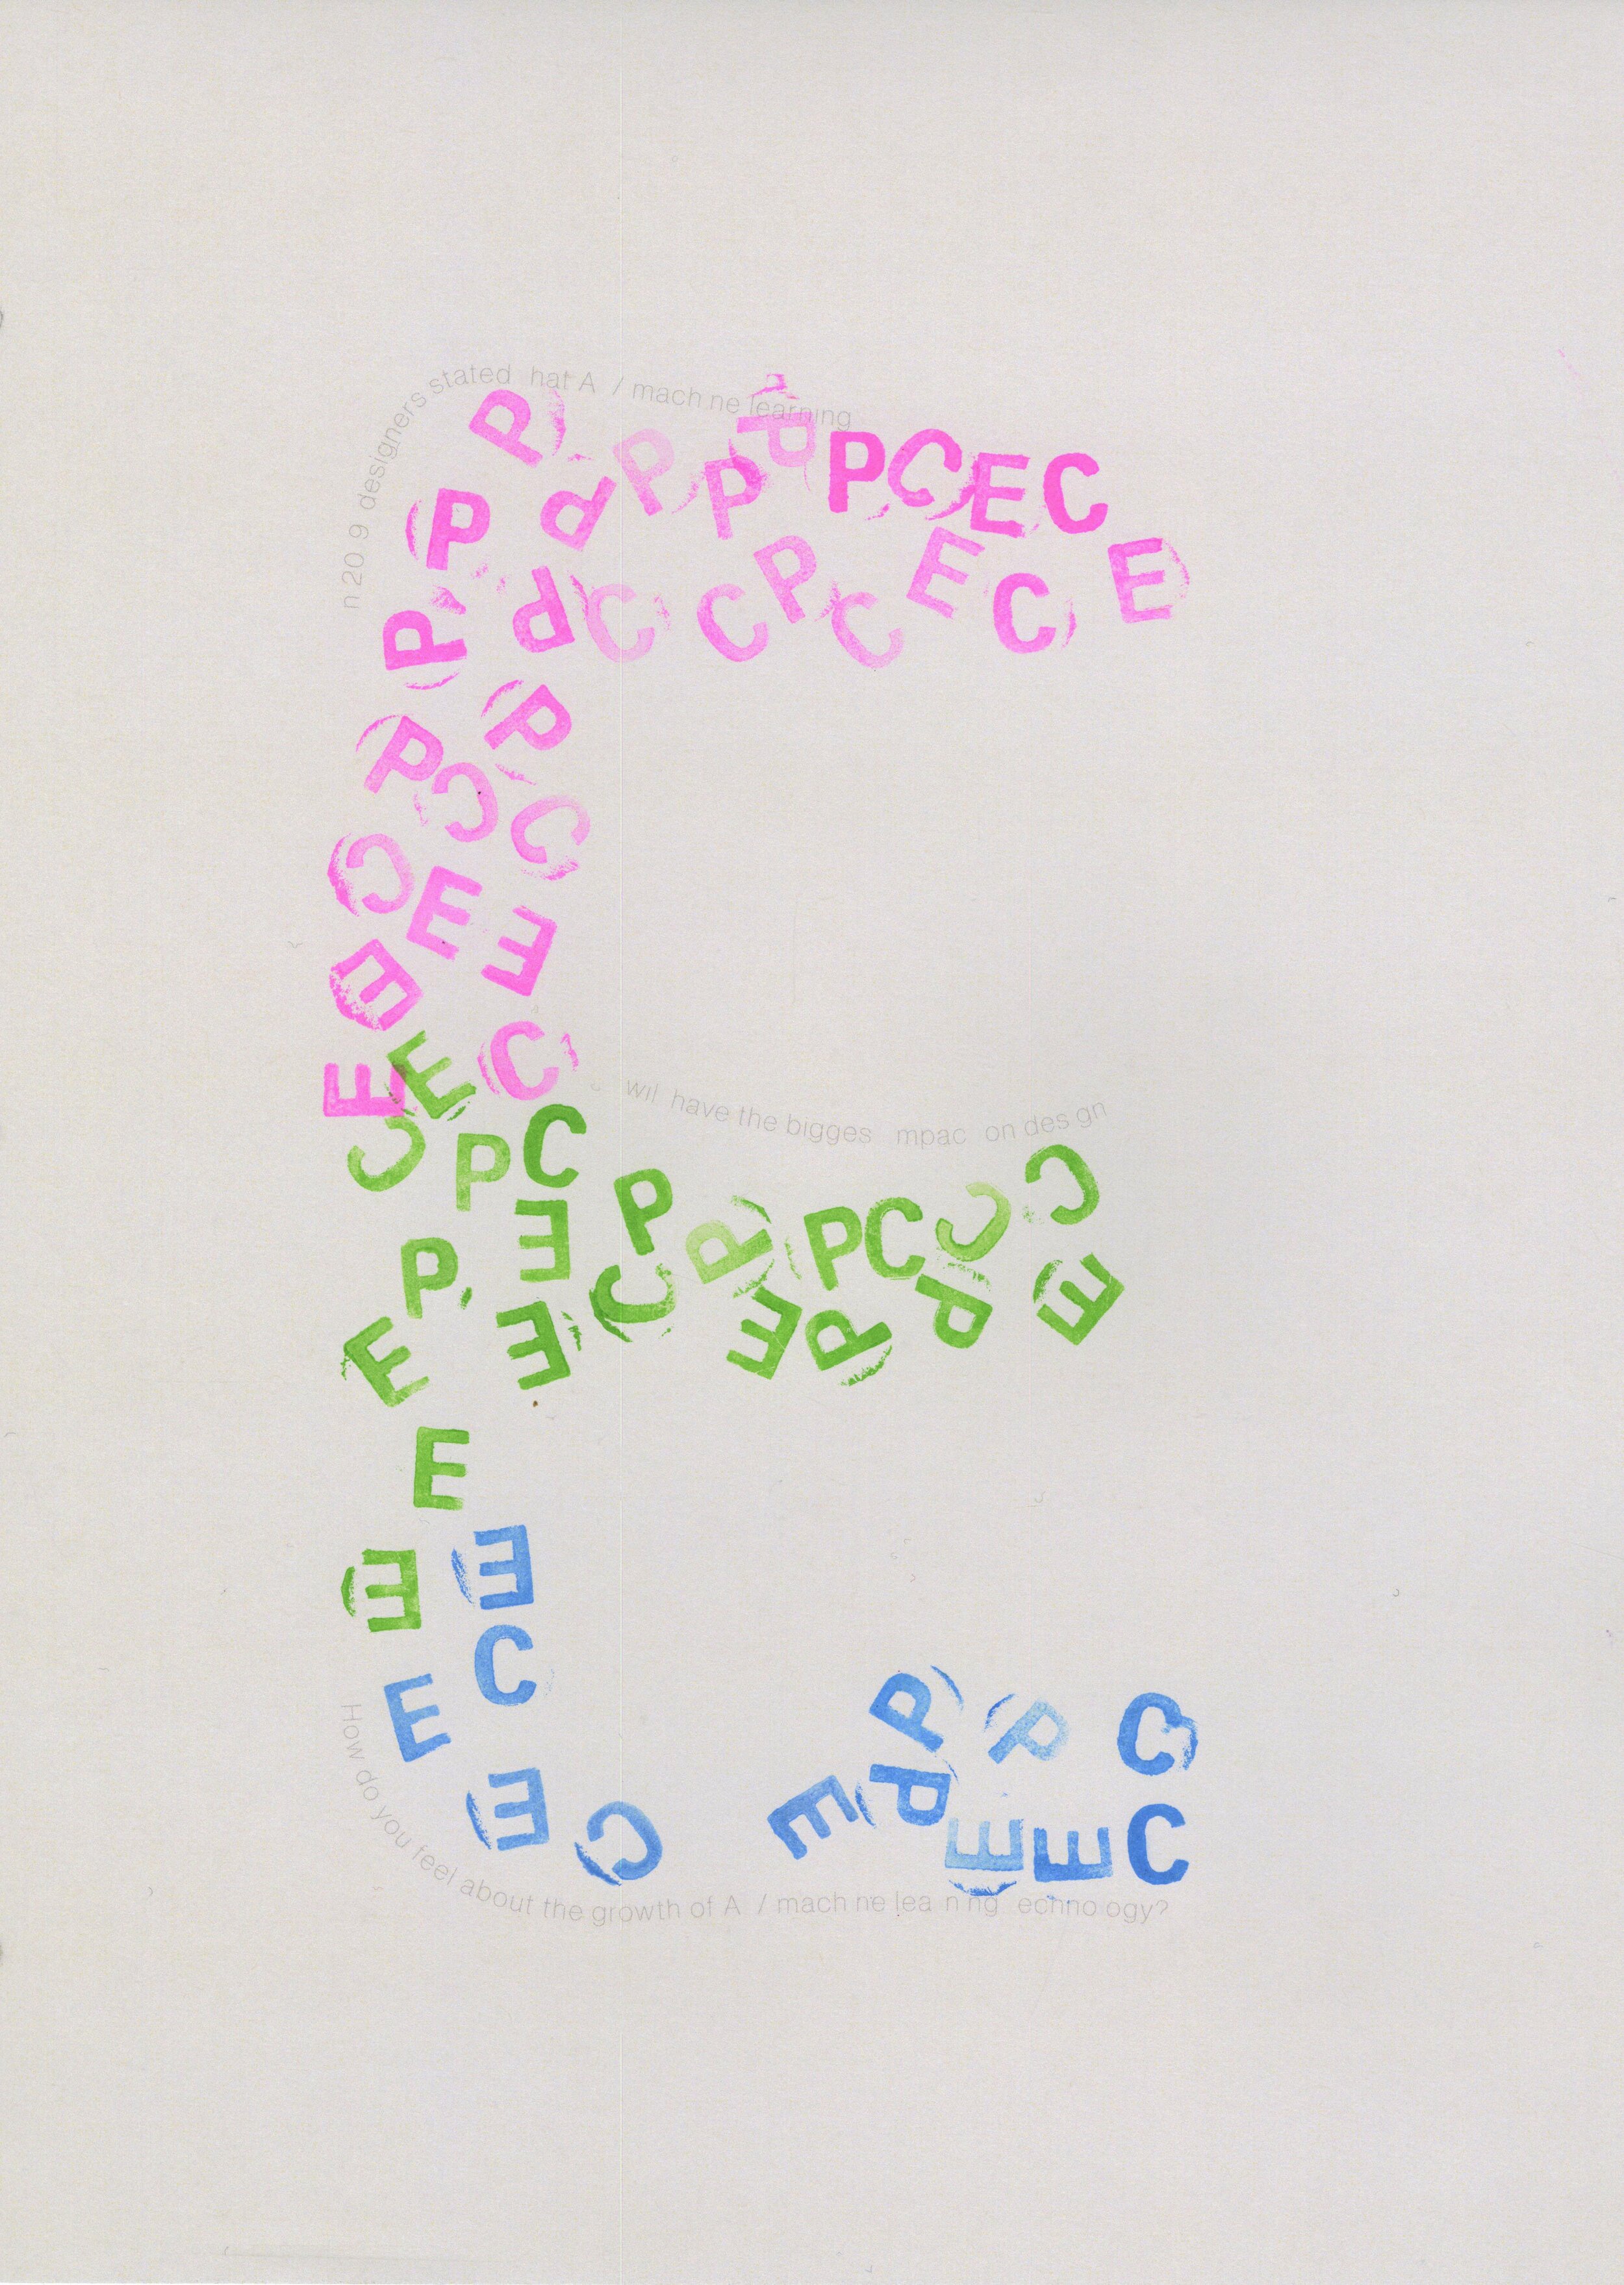
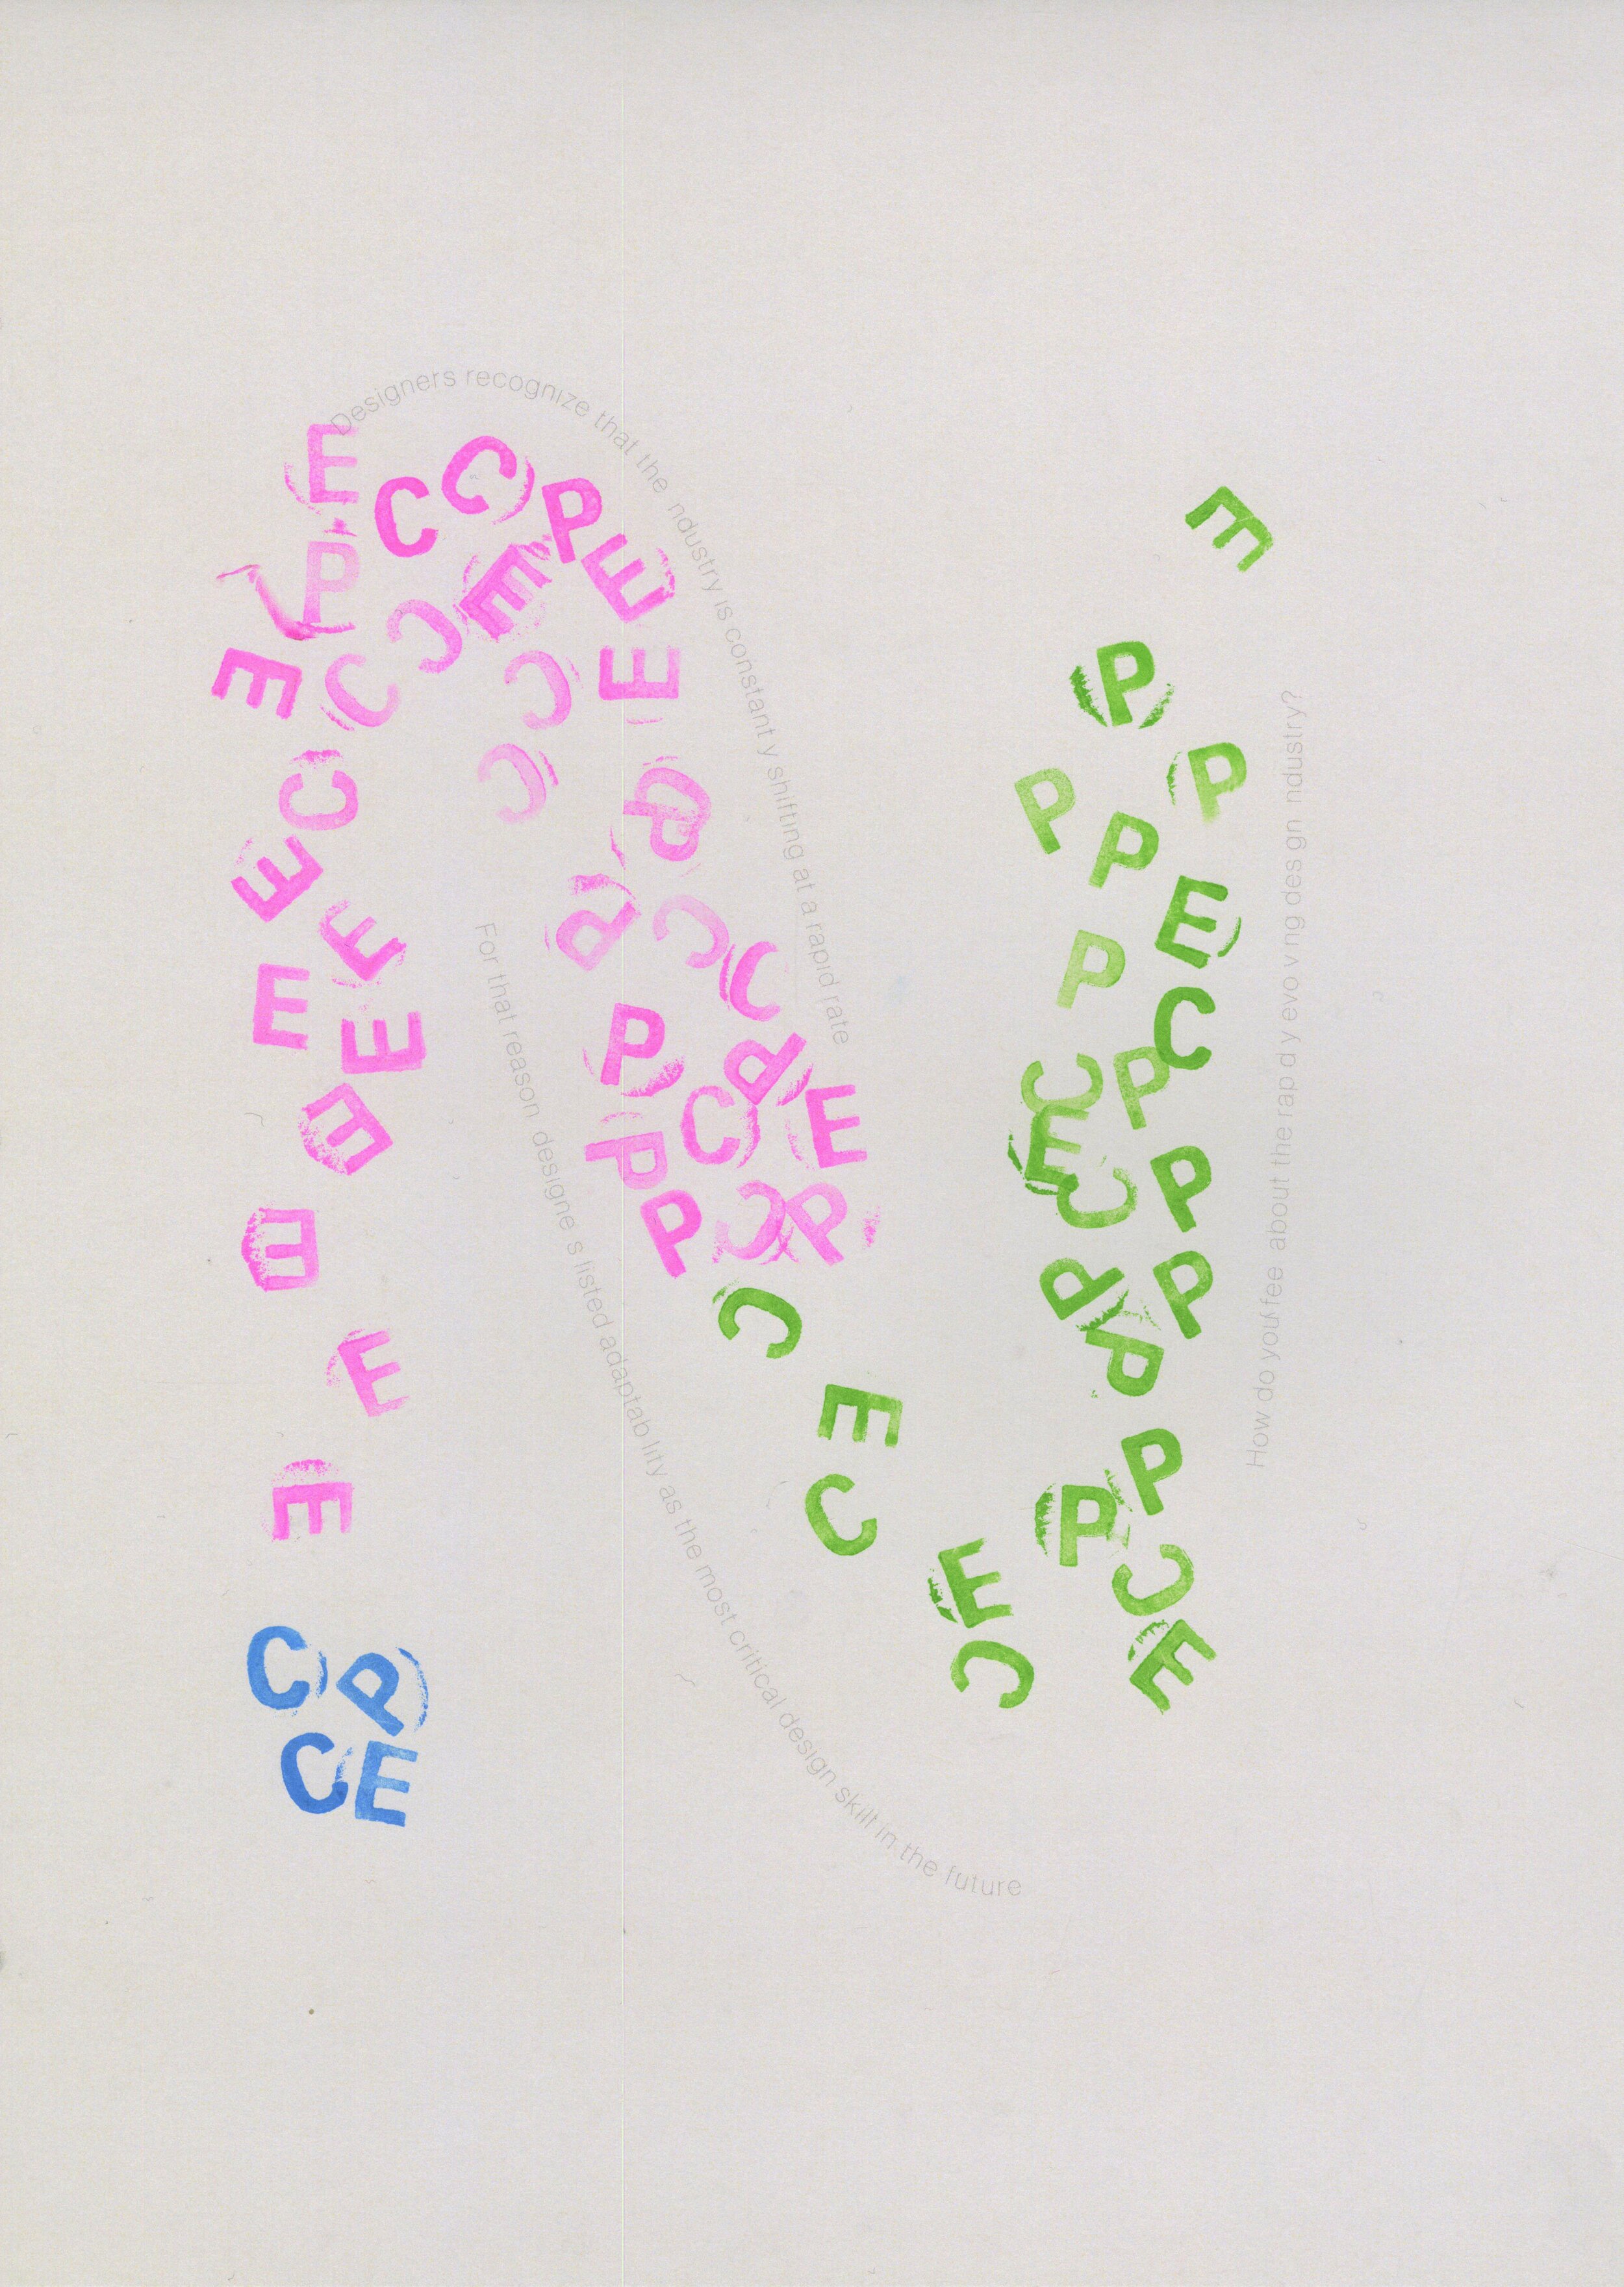
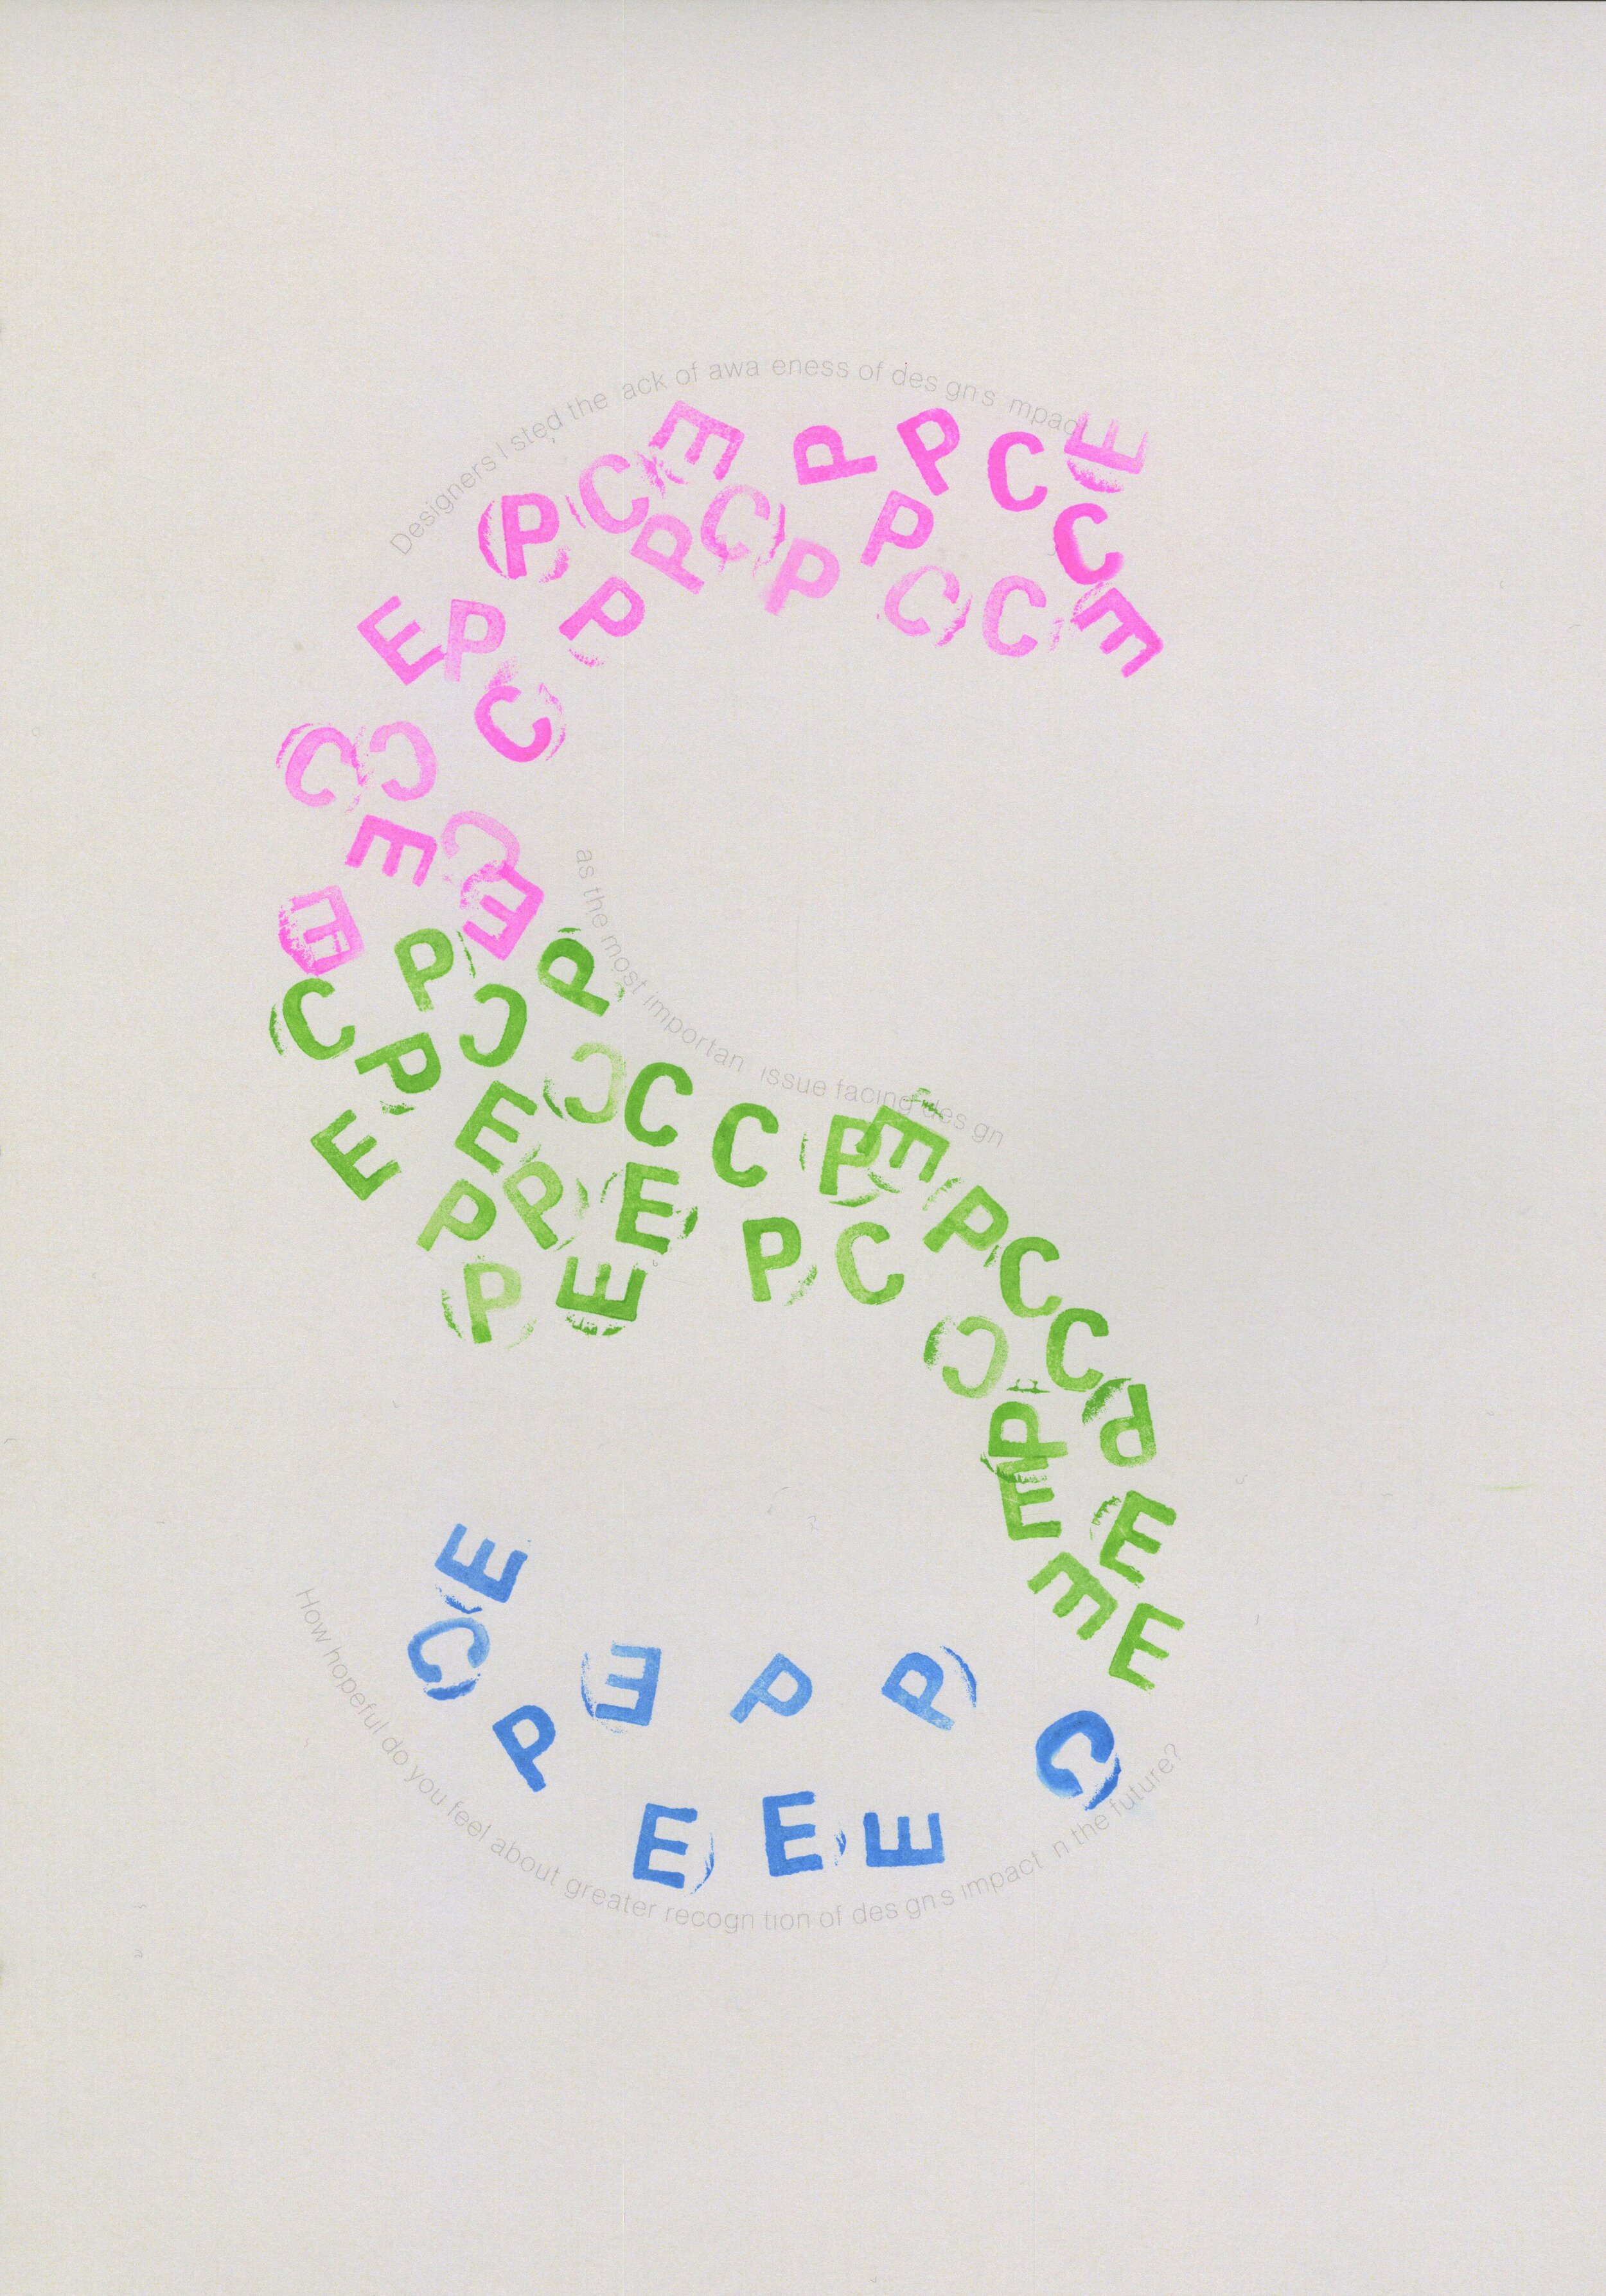
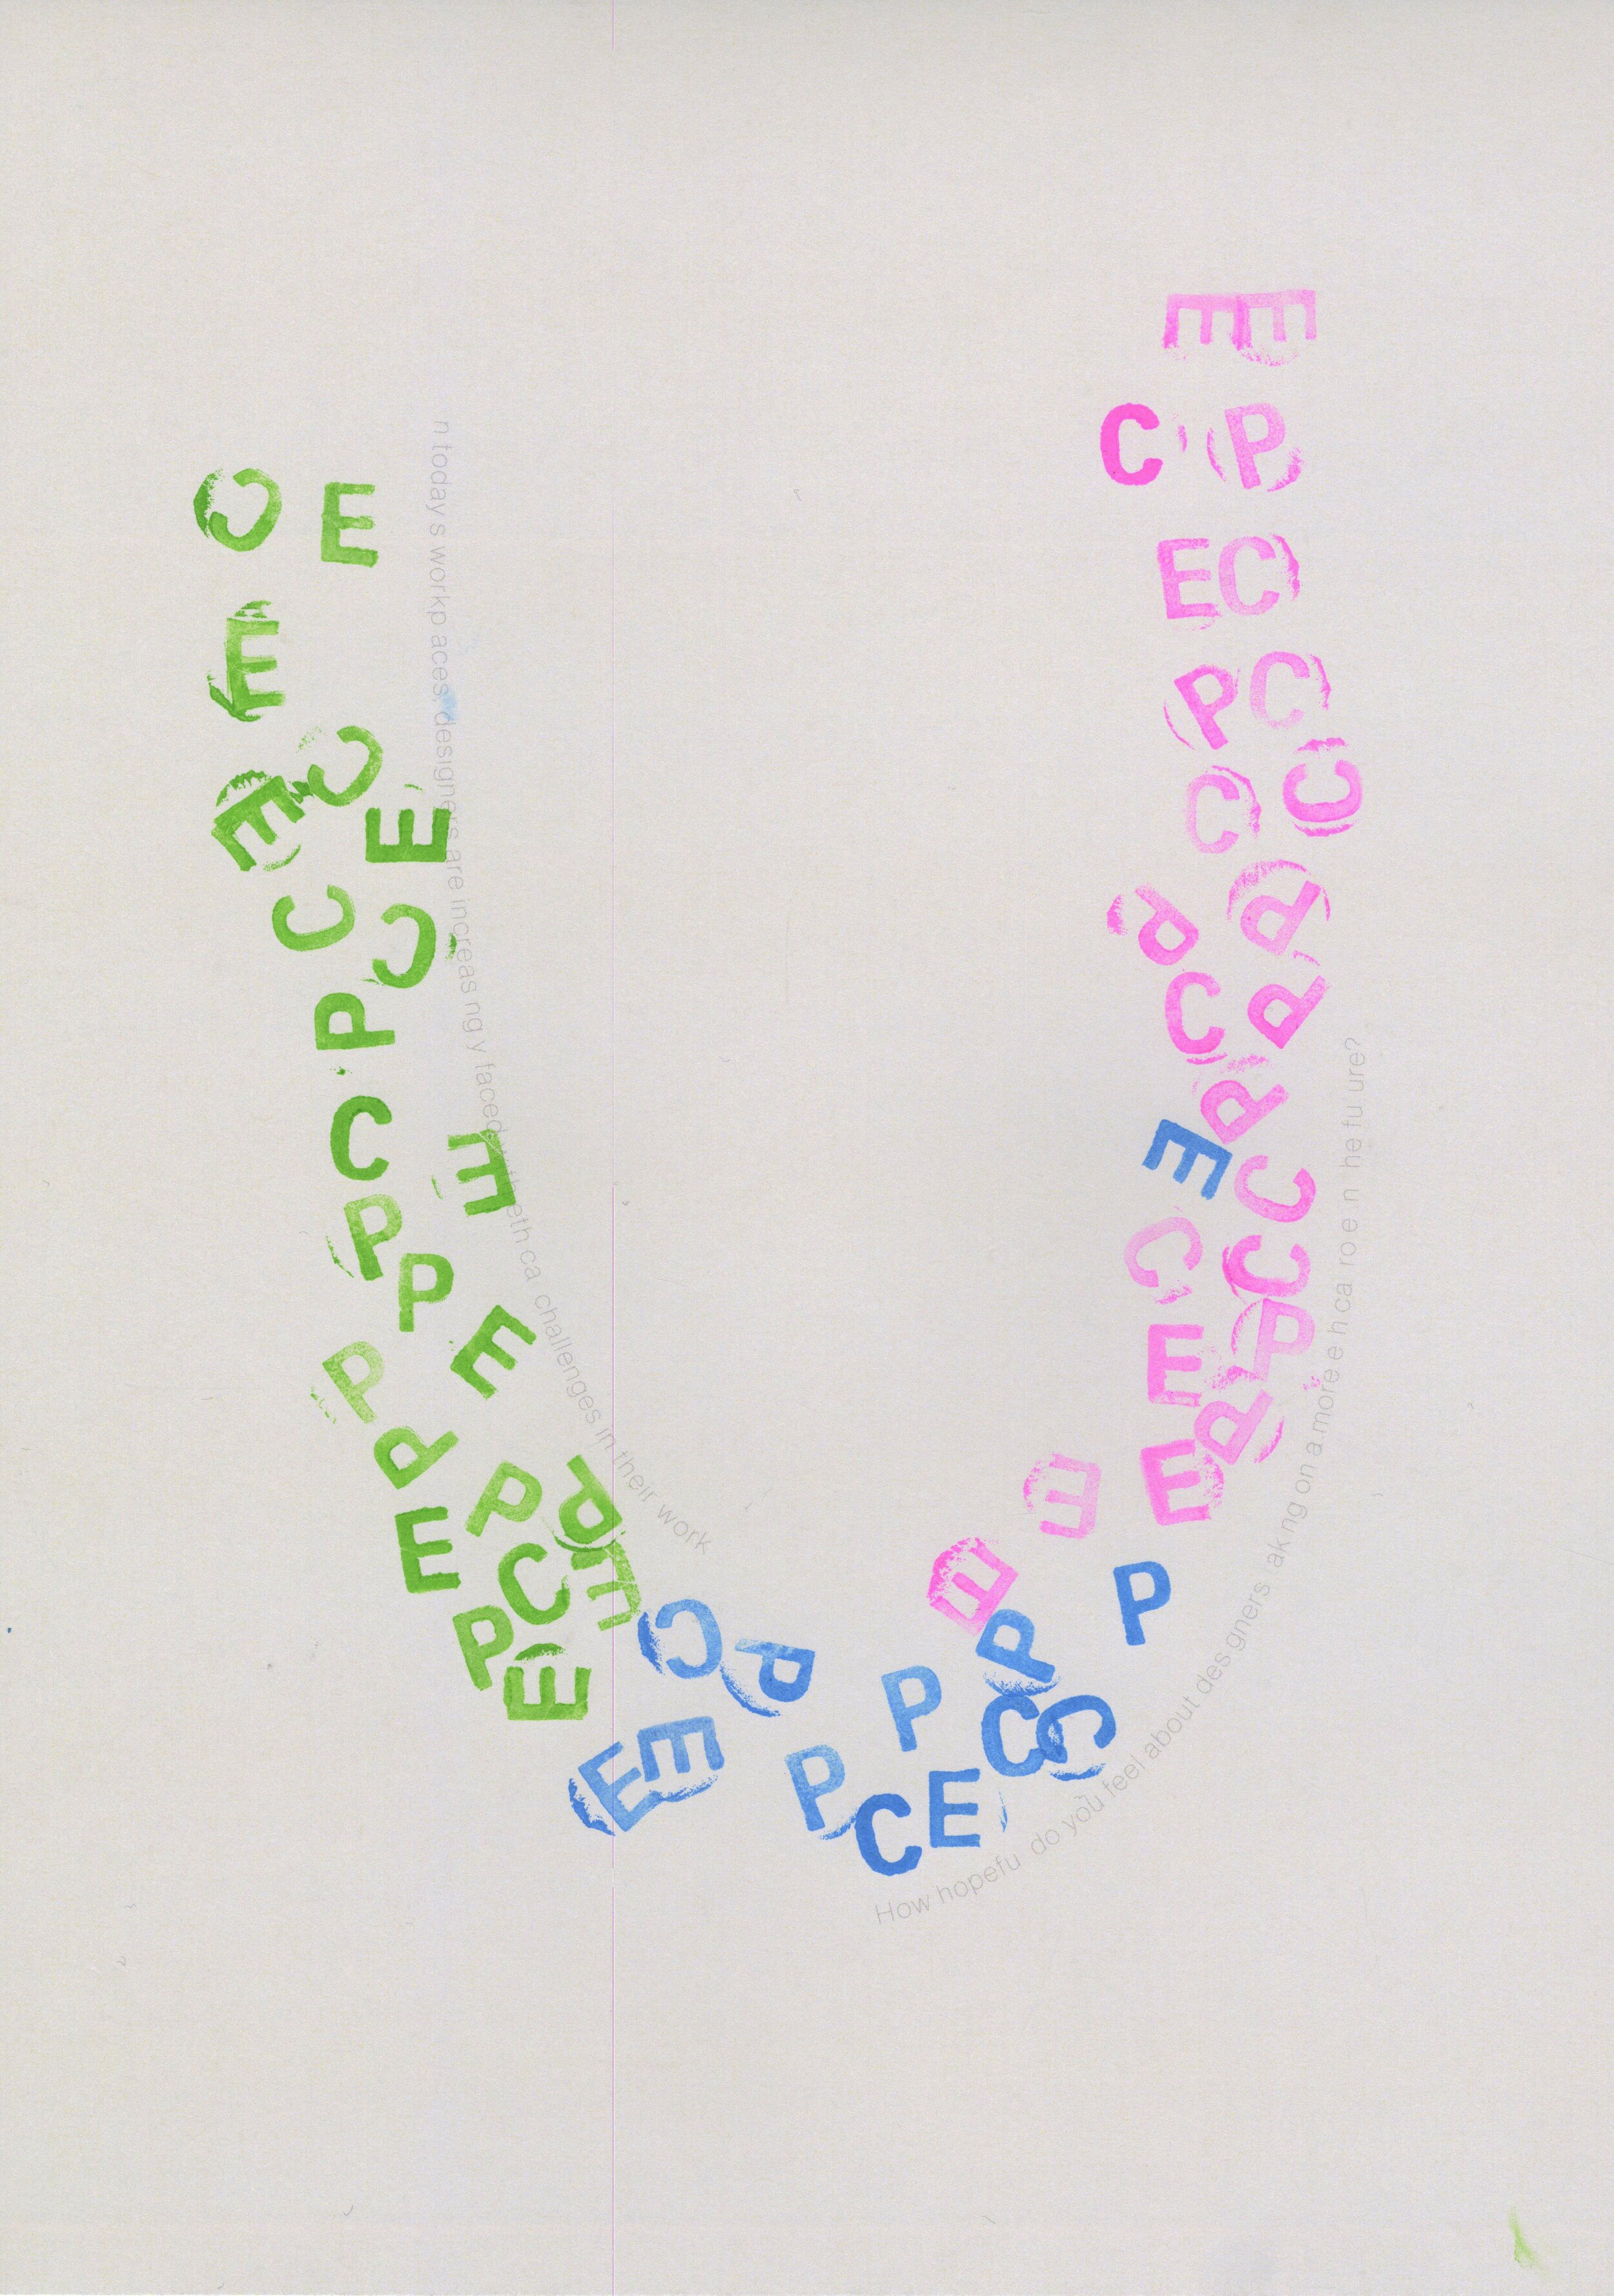
With one question per page, participants will use stamps to vote/state their opinion—positive, negative, or not sure.
Directions are as follows:
Choose the stamp based on your design track. (Communication, Product, Environment)
The color you choose will depend on how the question makes you feel—positive, negative, or not sure
Work together to form the letter; cluster your mark with those who responded similarly.
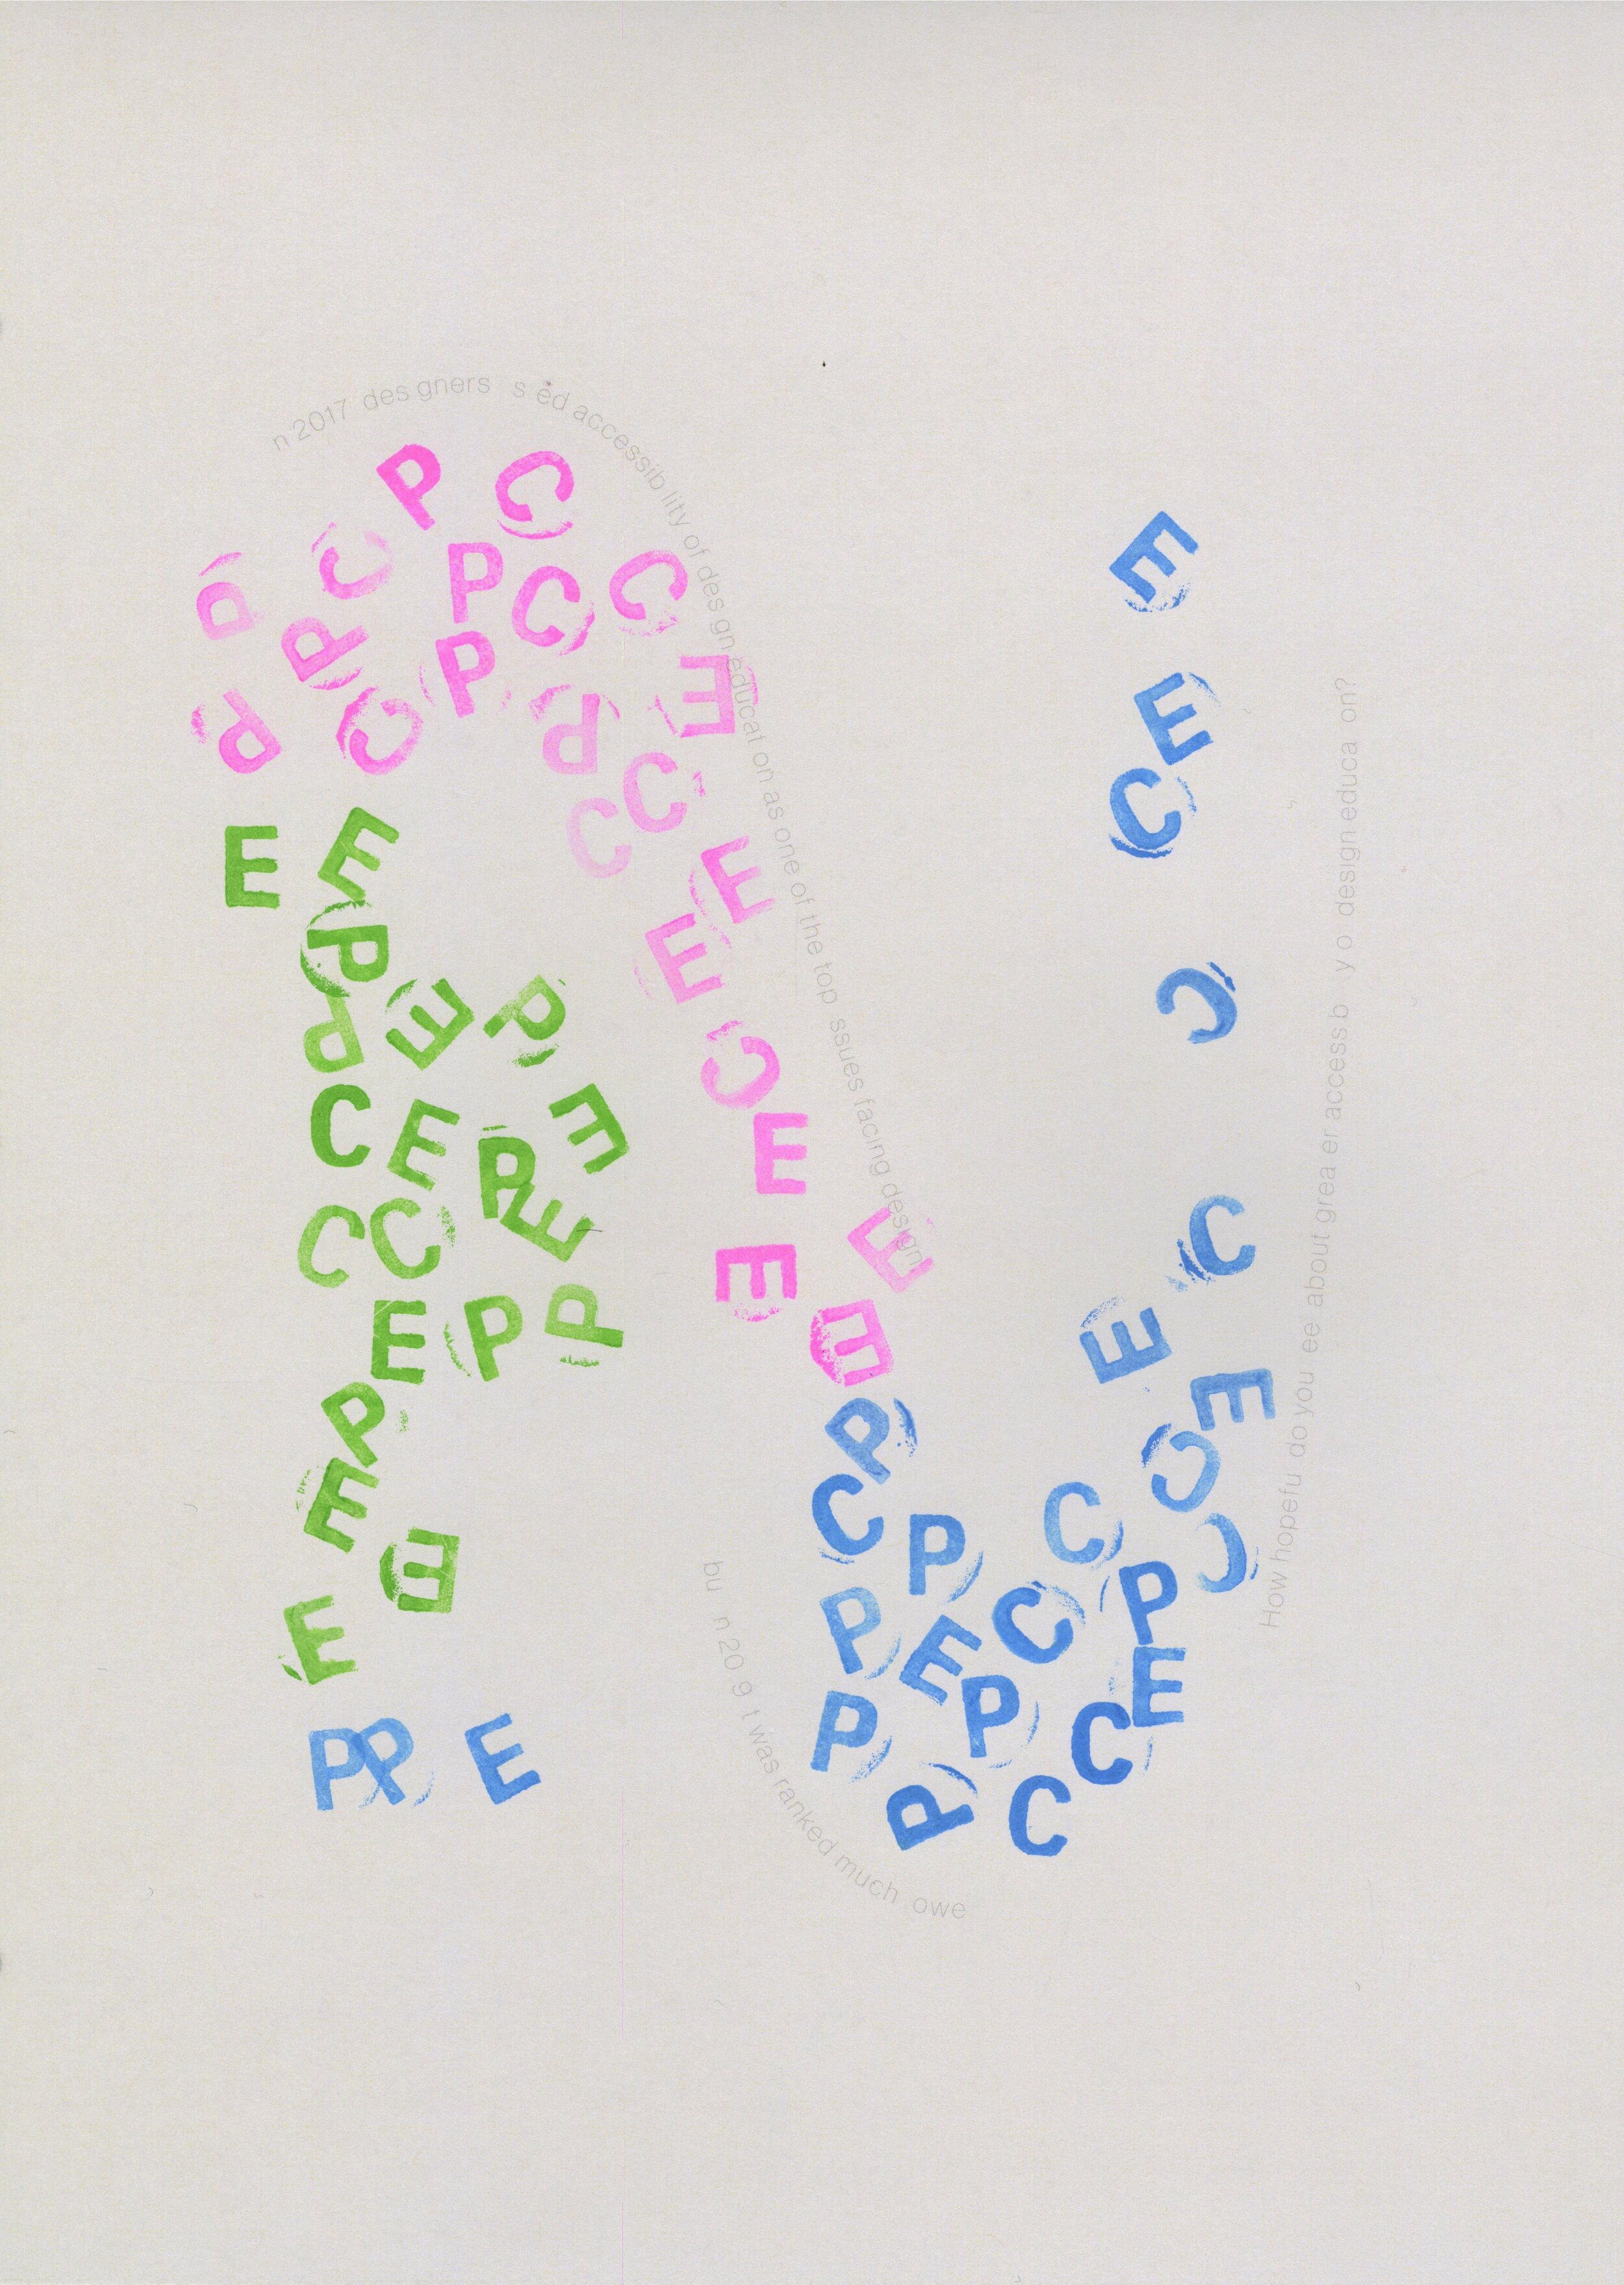
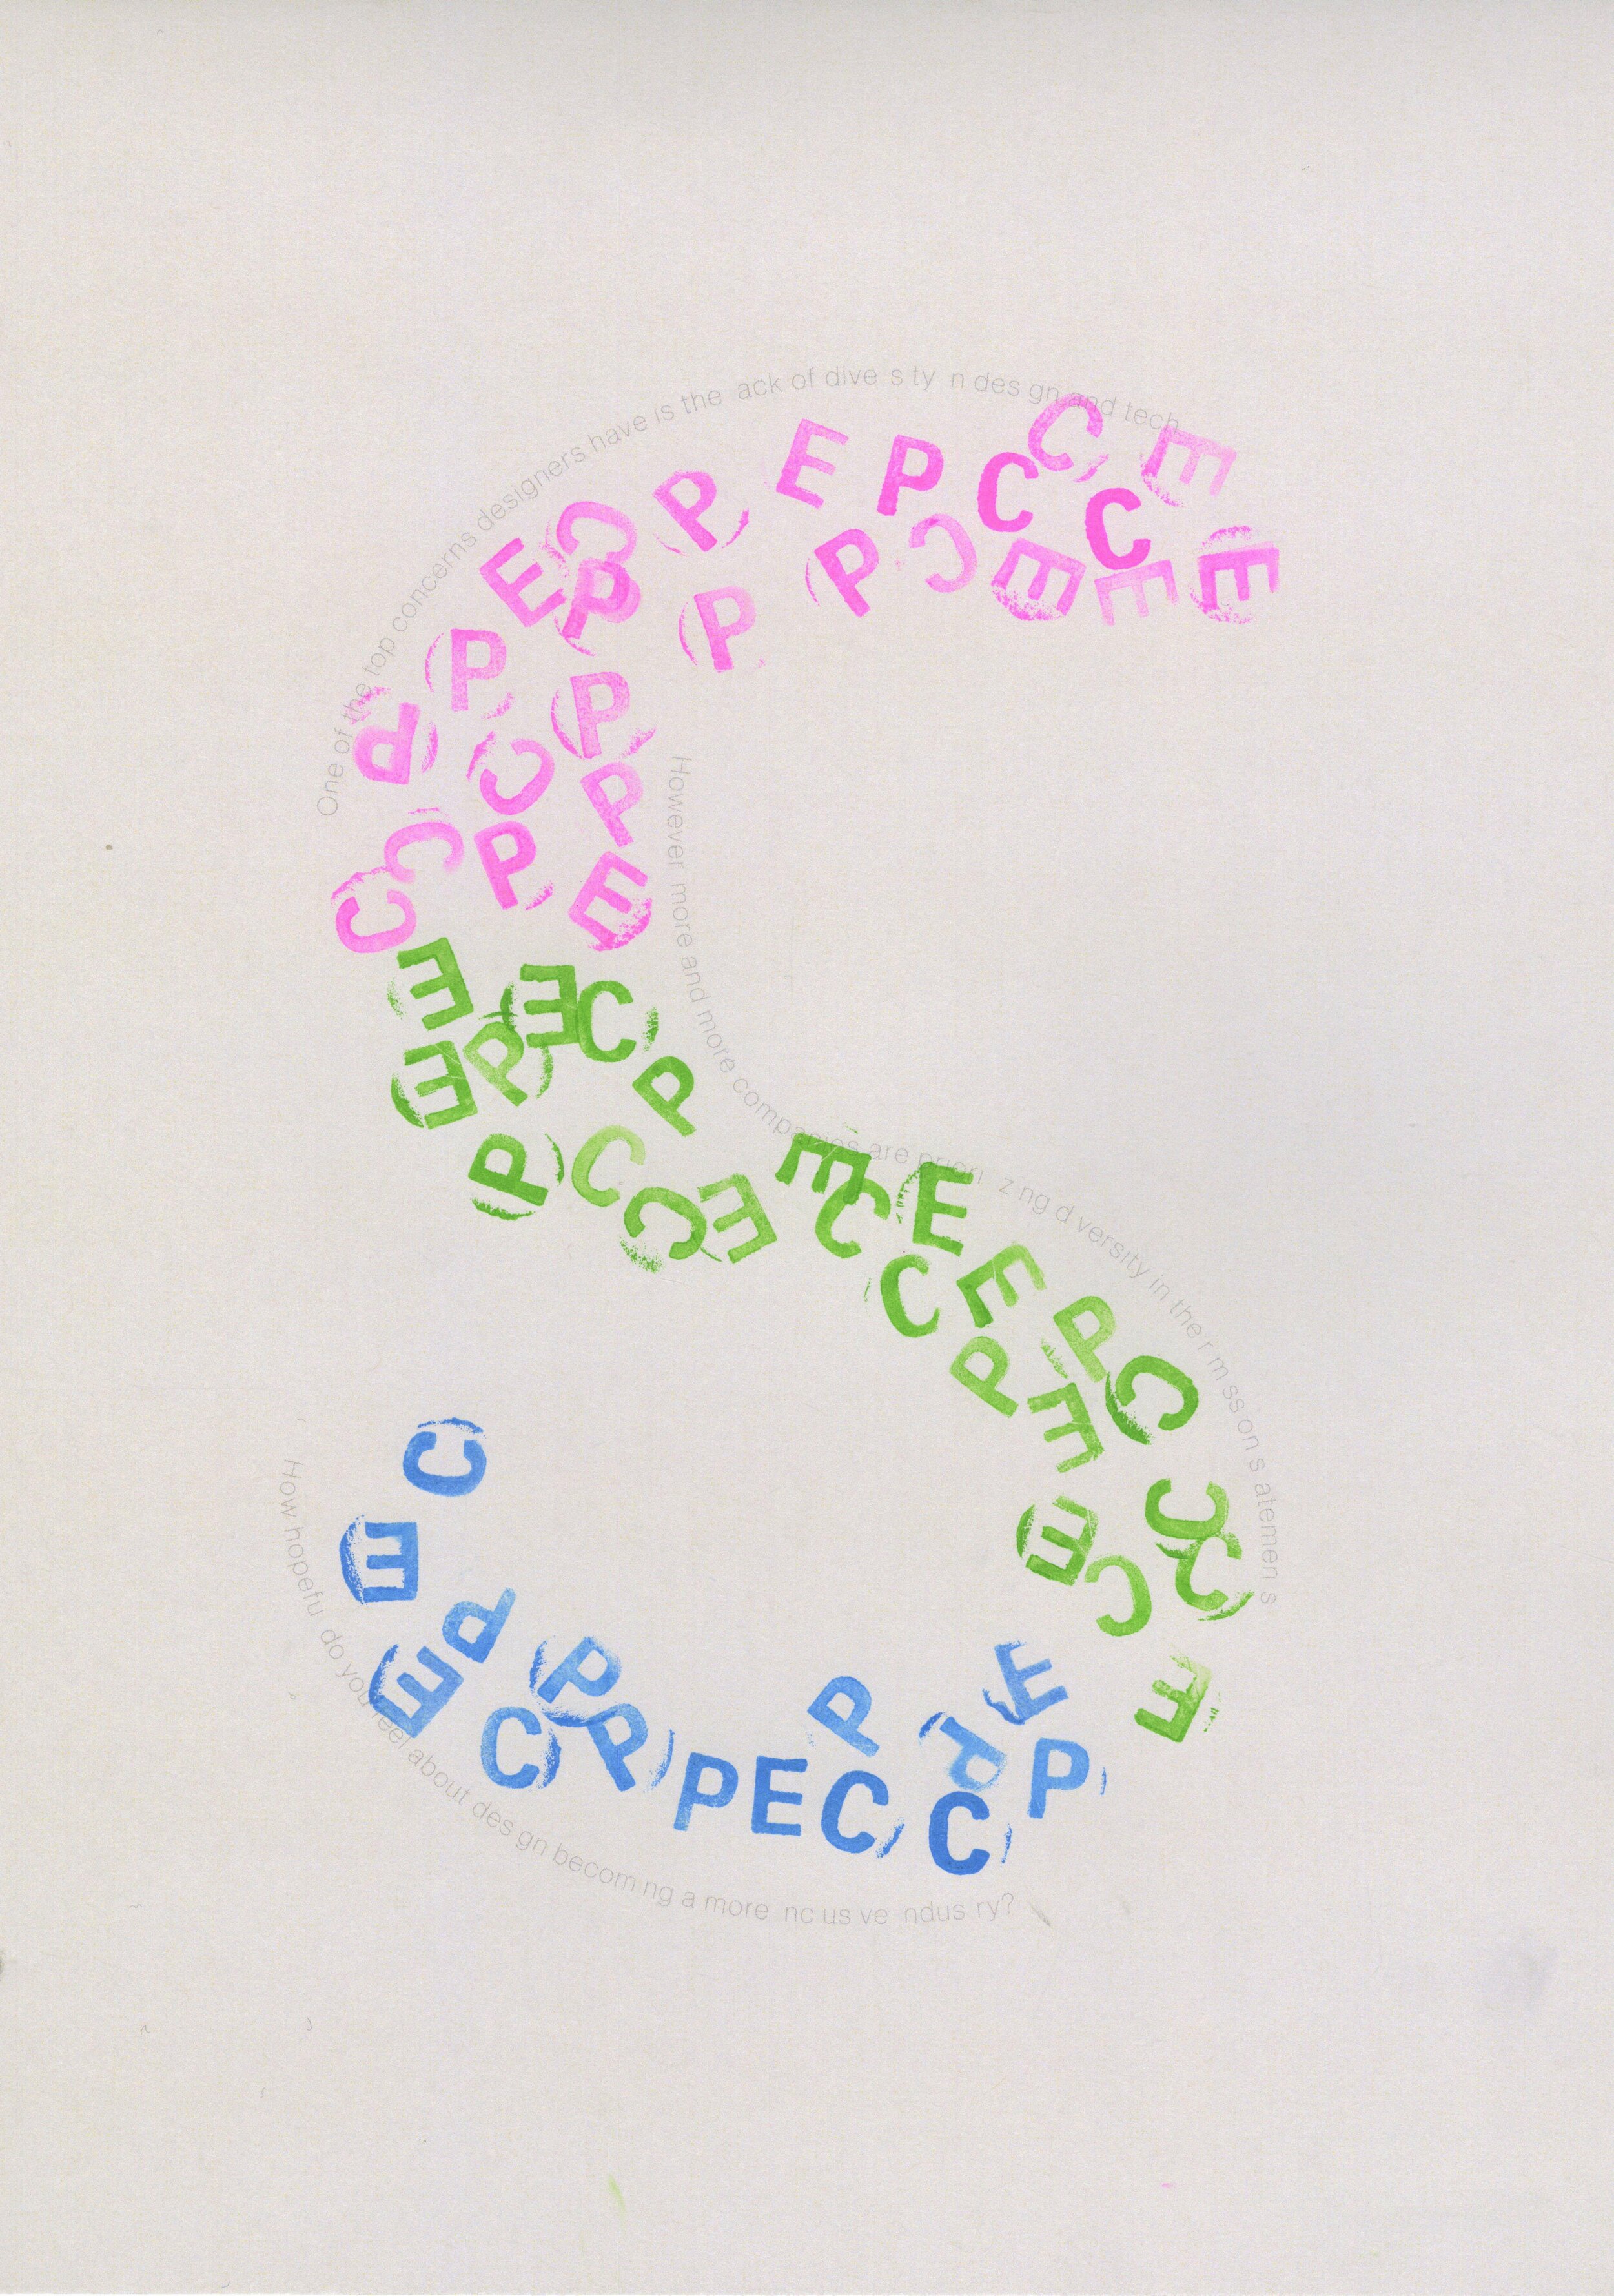
Prompt example from Industry section:
One of the top concerns designers have is the lack of diversity in design and tech. However, more and more companies are prioritizing diversity in their mission statements. How hopeful do you feel about design becoming a more inclusive industry?


Data Collection
We surveyed CMU undergraduate design students across all three tracks, often in groups of 2 or 3 to encourage discussion around our survey prompts.
We as students, had a lot to say…
“I’d rather be poor making a table, then making money and working in tech.” — Senior P [working in tech]
“For me, I went into this semester planning to branch out into other things besides design, but I realized that the intensity of design means that if you try to do both, you’ll fall short in both regards.” — Freshman E [challenging design programs]
It’s good. Less pixel pushing, more designing.” — Junior E [AI/machine learning in the future]


Installation

Analysis and Insights
Career: On the up and up? Of the three sections, “Career” comprised the most positive responses, with 43% indicating satisfaction with future job stability and the prospect of working on multiple projects at once.
Learning: Perhaps unsurprisingly, CMU students had a lot of opinions on design education. The majority voted decisively (either positive or negative) at a rate of 68%.
Industry: As a whole, our respondents expressed hope about the increasing recognition of design, but remain divided on the industry’s ability to meaningfully diversify.
Breakdowns by Track:
C: Most Decisive, 44% Positive, 23% Negative
P: Most Not Sure, 43%
E: In between, 40% Positive, 20% Negative, 40% Not sure
Breakdowns by Prompt:
Most Positive: Interdisciplinary Approach, 82%
Most Negative: Resources, 55%
Most Not Sure: Fast-paced Culture: 57%